Nested table report

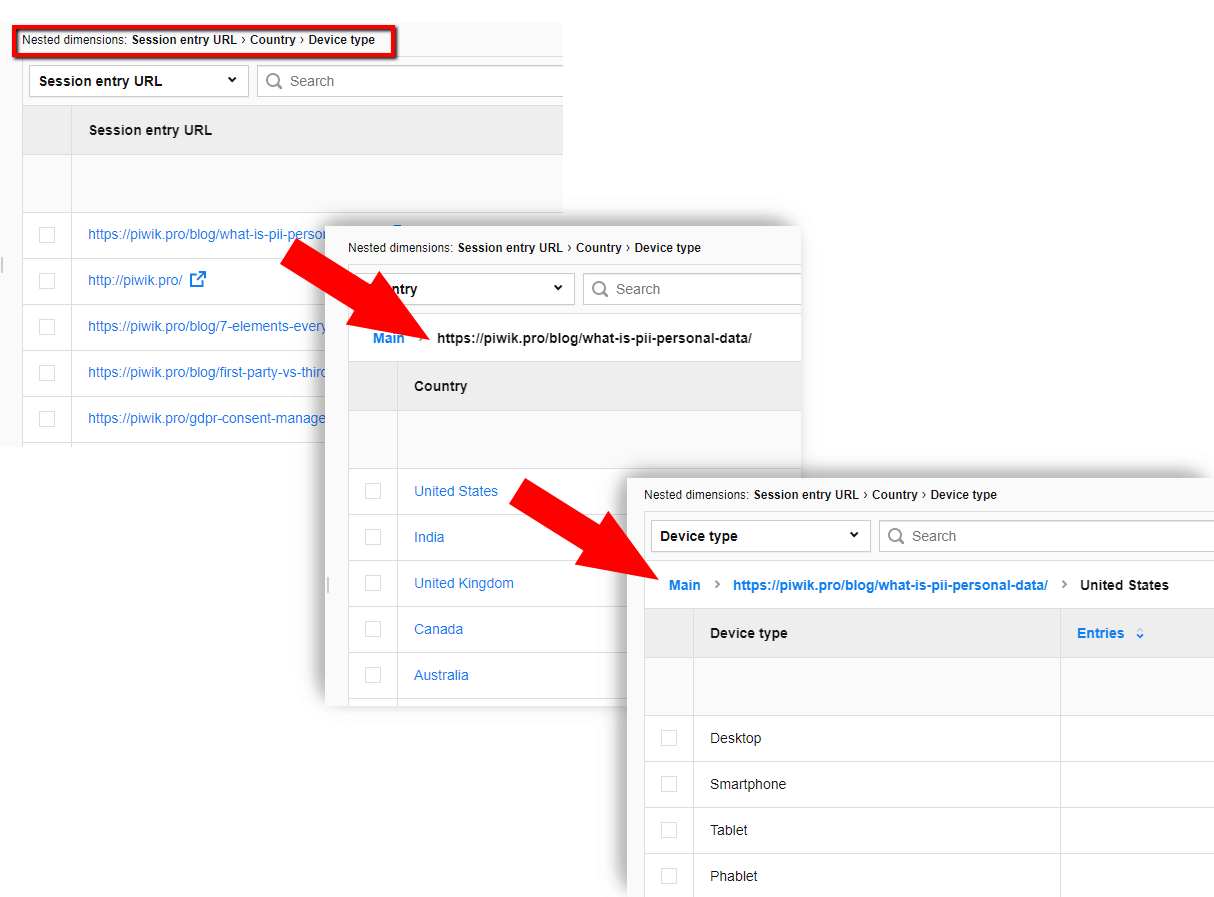
Nested tables are created when you select more than one dimension in a custom report. The report will display the dimension you selected first. When you click on this dimension the next selected sub-dimension will be displayed. You can continue drilling down on dimensions until you get to the last sub-dimension. Piwik PRO Analytics Suite allows for up to seven nested dimensions.

To find more information on tables and dashboards, check out our related posts:


  • University website personalization: First-party data strategies for student recruitment and retention

    University websites receive millions of visits annually from diverse audiences – prospective students, admitted students weighing their options, current undergraduates, graduate students, parents, alumni, and faculty. Yet most institutions serve identical content to all these visitors, missing critical opportunities to engage each audience with relevant information.

  • Digital marketing in the energy sector: Key challenges and fixes

    Summary The European energy and utilities sector is changing quickly. Customers expect smooth digital experiences, personalized communication, and easy access to their data. At the same time, regulators continue to tighten privacy and security standards across the EU. For marketing teams, this creates a familiar dilemma – how to deliver relevant, data-driven experiences while staying…