
As an analyst, you probably go by many names: numbers wizard, chart artist, data guru… But do you consider yourself a teacher? Or a storyteller?
Interpreting data is the foundation of being an analyst, but the ability to explain your findings and paint a picture that influences and drives business decisions is equally important. Your role is not to be a data middleman, carting data around from source to user. On the contrary: analysts’ true value comes from transforming data into action.
When sharing web analytics data you will inevitably run into the problem of data literacy (the ability to read and extract usefulness from data) among different individuals. Data literacy rates vary greatly within an organization, ranging from “just give me the data, I’ll handle the rest” to “I have no idea what I’m looking at. Can you please translate this into English?” How can you navigate varying levels of data friendliness and present meaningful insights?
The answer to your problems is analytics dashboards. You’ll be able to provide everyone from the technically savvy to the data illiterate (and everyone in between) with the relevant data they need to help them achieve their goals.
With a few key principles and some helpful tips in mind you can create dashboards that communicate clearly and drive action. This post will help you create effective, valuable dashboards that people will use time and again to make actionable decisions.
Without further ado let’s get down to increasing the value of your dashboards and analytical insights.
1) Consider who’s using the dashboard
The most important practice and foundation of dashboard creation is considering who will be using your dashboard. Stay focused on the end user: what questions do they want to answer using your dashboard? Which data provides the answers they need to help them do their job effectively?
As the old saying goes, different strokes for different folks. When it comes to data literacy, there are tremendous differences from one person to the next. You must take this into account. The graphic below shows how some people in your organization can interpret data with little guidance from you, while others require more written explanation and direction in analyzing and acting on data.
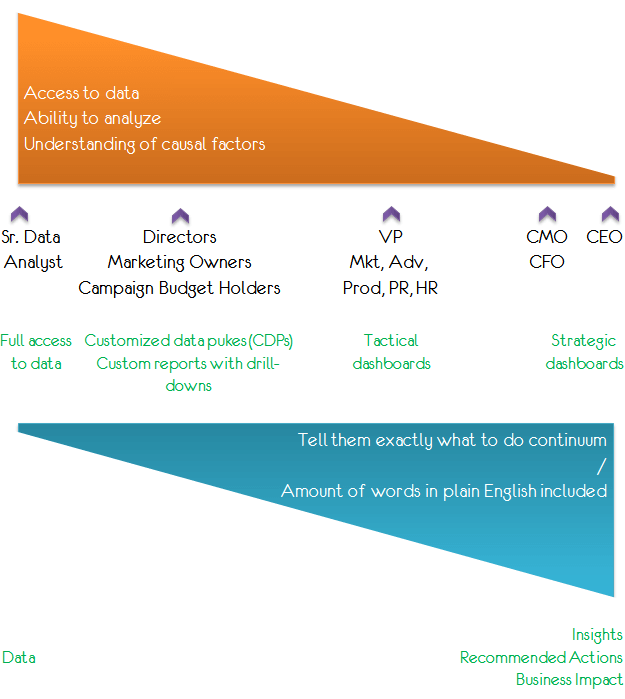
Dashboards are flexible, because they are created based on the needs of the end user. There will be plenty of unique situations that do not fit neatly into one of these categories. With that said, the dashboards you create will generally fall into three categories:
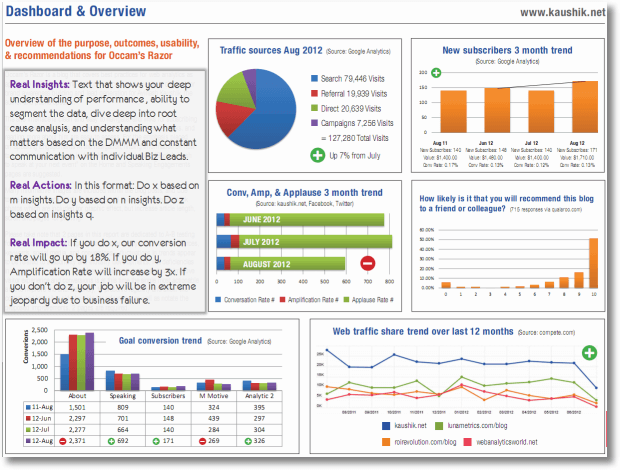
- Operational: Real-time data related to short-term operational performance. Operational dashboards (called CDPs in the graphic above) have the shortest scope or decision horizon, focusing on short term goals. These are for data literate audiences; they focus on metrics, with segmentation and drill down, and have little if any written insights (see the Provide Insight section) and recommendations.
- Tactical: This is where you start blending the written word with metrics. You’ll provide segmented data, written insights, recommended actions and business impact. Use historical data and compare it against established goals. Your data compliments your insights and shows your recommendations are backed by data.
- Strategic: A high altitude business-wide goals focus, utilized by senior management to get a bird’s eye view of an organization’s progress towards long-term goals. Strategic dashboards are the most text-heavy, providing insight and explanation of the condition of KPI-related metrics and recommendations on how to move them closer towards their goal.
Your head of performance marketing may be able to take raw data and run with it, but don’t expect the same from your CXOs and others far removed from analytics data.
Considering how data literate your dashboard recipient is, you’ll need to adjust how much explanation you provide with written text and how much is left up to the viewers’ interpretation. The better they are with data, the less you need to write – they will be able to draw their insights and action plans from the raw data.
On the other hand, for those who are not so data savvy, you’ll need to spell things out a little more – explaining what the data shows and why. When presenting your analysis, supplement written insights – see the ‘Provide Insight’ section – with data and graphic visualizations to back-up what you write. This gives users hard evidence for reference to confirm your written findings.
Depending on the end user, some dashboards can be a nice blend of written content and data, while others will rely heavily on written explanations of findings, recommended actions and business impact (we will talk about these later).
Whether you go for dashboard full of data or full of words, always provide some visualization to reinforce your insights and recommendations as an analyst.
COMPARISON
The comparison of 10 web and app analytics platforms
Learn the key differences between Piwik PRO Enterprise, Google Analytics 4, Matomo Cloud, Adobe Analytics, AT Internet, Countly Enterprise, Mixpanel Enterprise, Amplitude Enterprise, Snowplow Enterprise, and Heap Premier.
2) Provide context for data
Metrics rely on context to tell their story and give meaning and usefulness to data.
For example, you report on your dashboard that there were 120 form conversions in April. Without context, it’s impossible to interpret if this is good news (conversions are up from 80 last month), or bad news (down from 190 last month).
The example above lacks a historical context to show the performance of a metric over time.
Let’s look at a few ways you can provide context for your data:
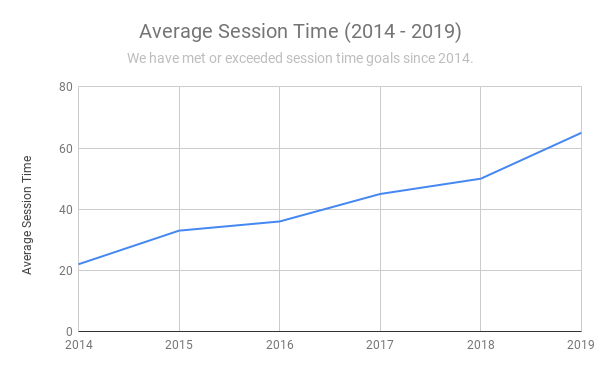
Goals – Use predetermined goals to show where metrics stand in respect of target performance. This is a great way for people to quickly judge how a metric is performing.
Benchmarks – Compare your metric’s performance against industry standards to see how you stack up against the competition and if your metrics meet industry norms.
Historical data – One of the most popular contexts, historical data shows a metric’s status over time to give the big picture. Follow metrics over time to grasp their long-term performance.
Thresholds – If you have minimum or maximum metric limits, they can help paint a picture when added to your charts.
Lack of context and fragmented data hurts the dashboard’s ability to help make educated decisions. The two charts below are dramatic examples showing how two different stories are told by leaving out the month of April.
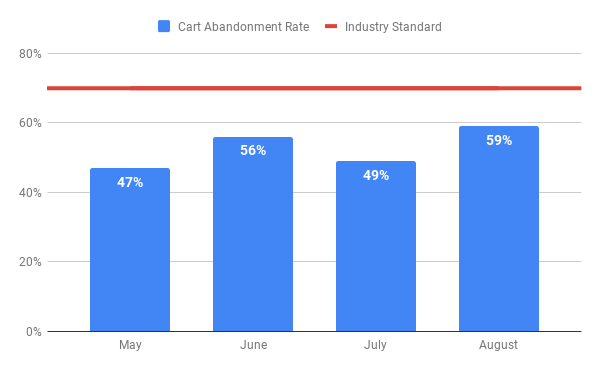
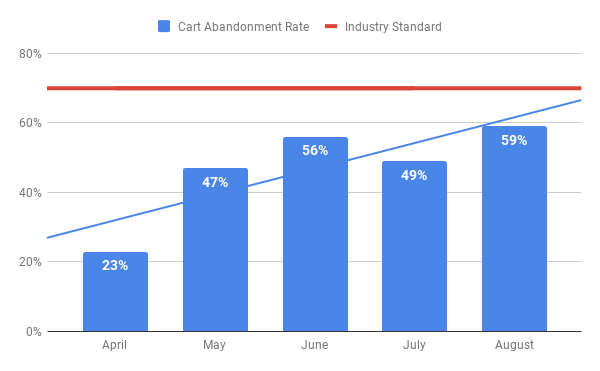
Remember: the more context you give, the clearer your story is!
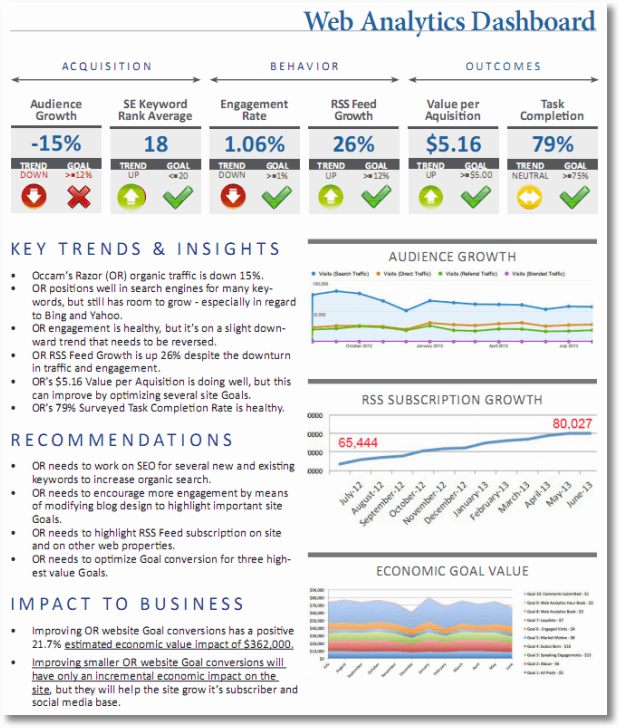
3) Provide insight
Data without context lacks meaning; data without insight lacks reason.
Our ‘About Us’ page has 30% more visitors than last month.
VS
Since we moved the ‘About Us’ link to the website’s navigation bar last month the page has 30% more visitors.
Bounce rate has increased since we launched the newly designed website.
VS
Due to the increased amount of high resolution images, page load time has increased since the website redesign, in turn increasing the bounce rate.
Insights are written explanations of what you’ve found in the analytics data. They tell you why metric values have changed, for better or for worse, in a way people can understand. Unless you’re making a dashboard for someone with a high-level understanding of the metrics and data presented there, data interpretation shouldn’t be left in the hands of dashboard users.
For more information about customizing dashboard layouts, check out our blog post:
Customize Piwik PRO Dashboard in 7 easy steps
4) Recommend action and provide business impact
After providing data and insights, share your recommendations on what action to take to improve this metric. First insight, then recommended action.
Let’s use the bounce rate example from above:
Insight: Because of the increased amount of high-resolution images, page load time has increased since the website redesign. This has in turn increased the bounce rate to 60% from 35%.
Recommended Action: These images can be further compressed without losing quality. This should reduce page load time, and in turn decrease the bounce rate.
Share the business impact of these actions. If the metric has a monetary value associated with it, you can assign it a revenue value. If there’s no revenue value, you can just explain how/why the metric will improve over time after the action is taken.
Impact: In the best case scenario the bounce rate will be even lower than the original page design (>35%) due to the improved UX of the new page. At a minimum we should see the bounce return to the values (35%) we were seeing with the original page design.
Providing impact brings your analysis and recommendations full circle. It makes your case for actions to be taken more persuasive, and demonstrates your full understanding of how analytical metrics affect business goals.
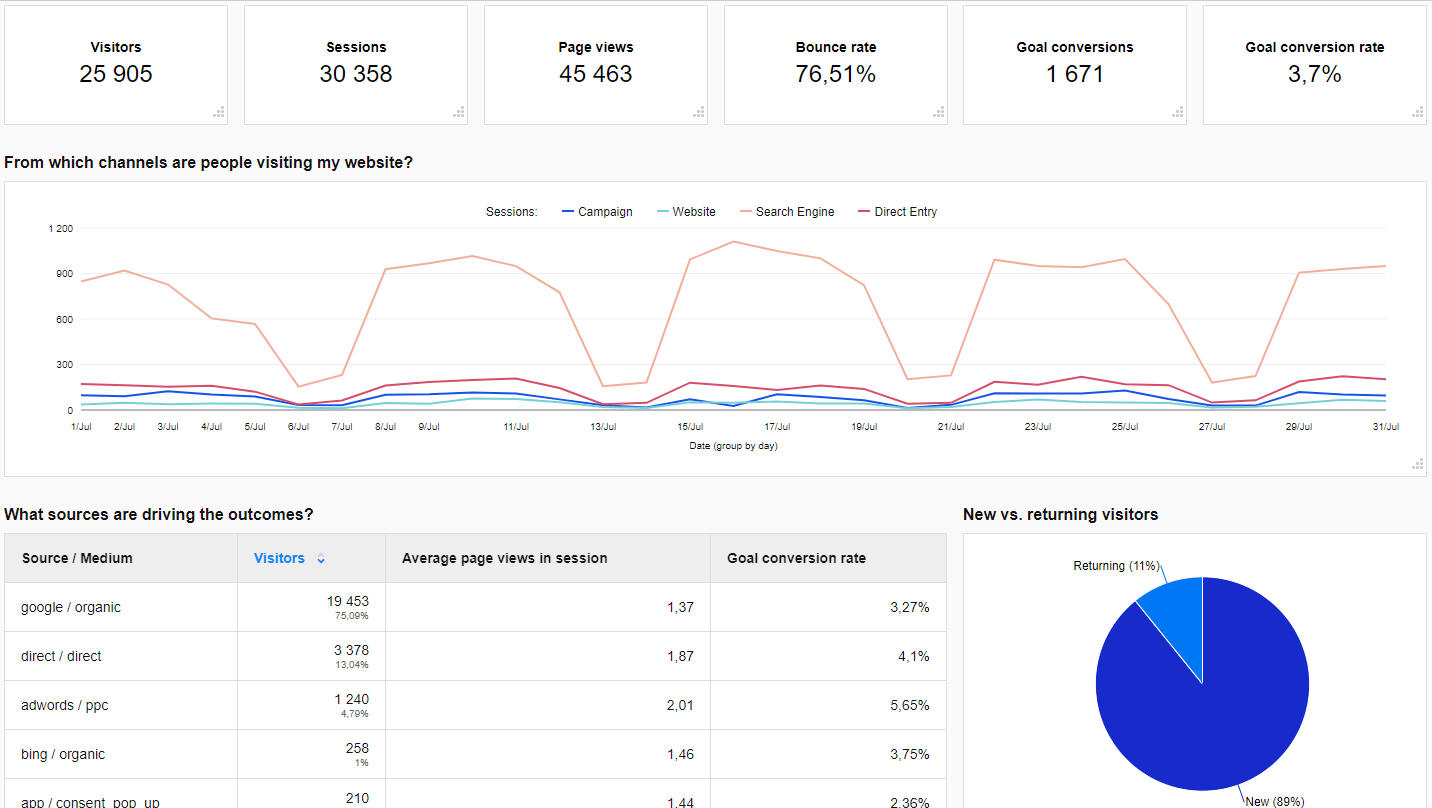
5) Don’t overwhelm people with too much data
When you present too much data (this is known as “data puke”), you’ve ruined the whole purpose of the dashboard: providing actionable insights.
Loading up on data without reason, explanation or insight doesn’t deliver much value to the person using your dashboard.
Try to limit your dashboards to 5 metrics per page, keeping the focus and intention of the dashboard clear.
“But these metrics are relevant and I can’t get rid of any!” Fair enough, but consider breaking them down into more than one dashboard and using tabs to segment the information. This way metrics will be visible and the viewer won’t be overwhelmed. They will be able to quickly draw conclusions about the data and check your analysis against it.
When constructing dashboards for multiple people and teams, provide the data most relevant to reaching their goals. A quick example: while the UX team may be fascinated with data about screen resolutions, it’s unlikely the HR team will learn much from this info. Keeping information actionable will reduce the risk of overloading people when they use your dashboards.
Scrolling is always a by-product of crowded dashboards. In addition to breaking the “5 metrics per page” guideline, scrolling disrupts the focus of the dashboard user. Scrolling to see one part of a report hides another, undermining your efforts to create user-friendly dashboards. It’s best to present as few metrics as needed, focus on the matter at hand and present the most valuable insights without distraction.
6) Churn metrics and dashboards overtime
Business needs change over time. Remove metrics as they become irrelevant to your business needs or goals. Eventually, entire dashboards can become worthless over time – monitor this and prepare an overhaul or replacement as needed.
You can spot a dashboard that is losing its usefulness/popularity by tracking who is using your dashboards and how often. A drop in dashboard use can signal many things. It may be that the metrics/goals setup is no longer relevant for its audience. It could indicate that your dashboard needs more work to meet the specific needs of the target user.
The bottom line: if people aren’t using your dashboards, it’s because they aren’t useful. It’s a good time to take a step back and analyze the situation, communicate with the people these dashboards are supposed to help, and develop a solution.
Keep your dashboards relevant so they can offer value, insight, and actionability.
7) No Squeezing
Don’t squeeze (compress) your charts to fit them all on one page. Not only does this make individual charts hard to read, but the total effect overwhelms the dashboard’s users. Chart “squeezing” is a telltale sign you have too many metrics on one dashboard. Remember what we said before: try to keep it down to 5 metrics per dashboard.
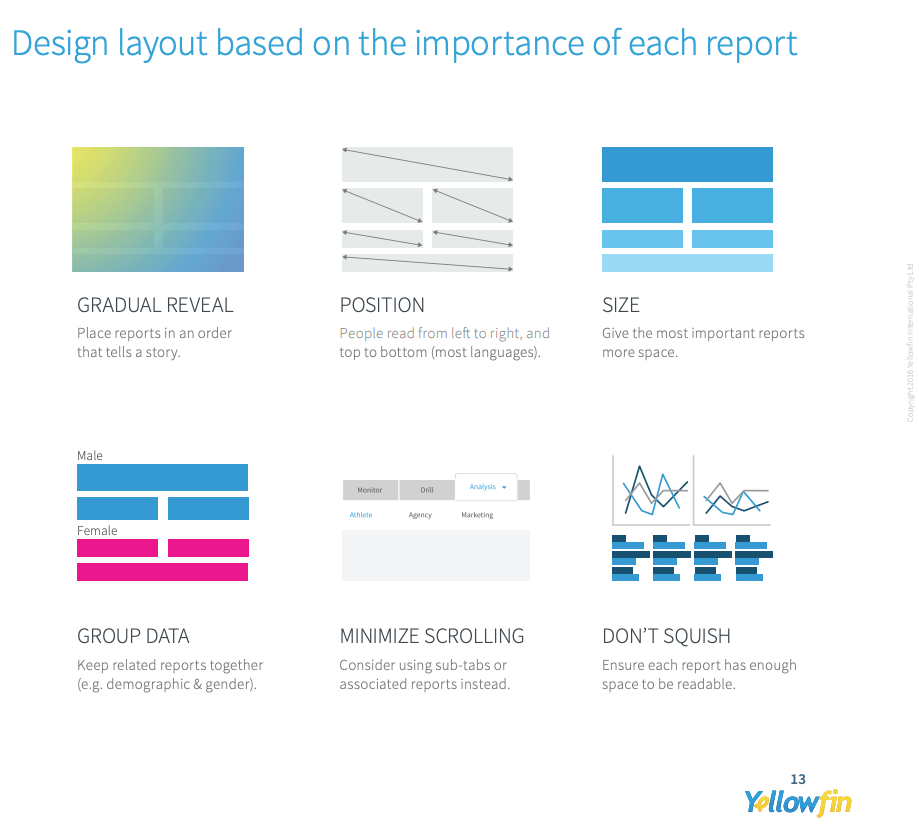
8) Organize your dashboard logically
Your critical insights and the most important data should be presented before anything else. Each section of your dashboard should read from the top (most important) to the bottom (least important). People using your dashboards will appreciate the ability to quickly get the information they need to make strategic decisions.
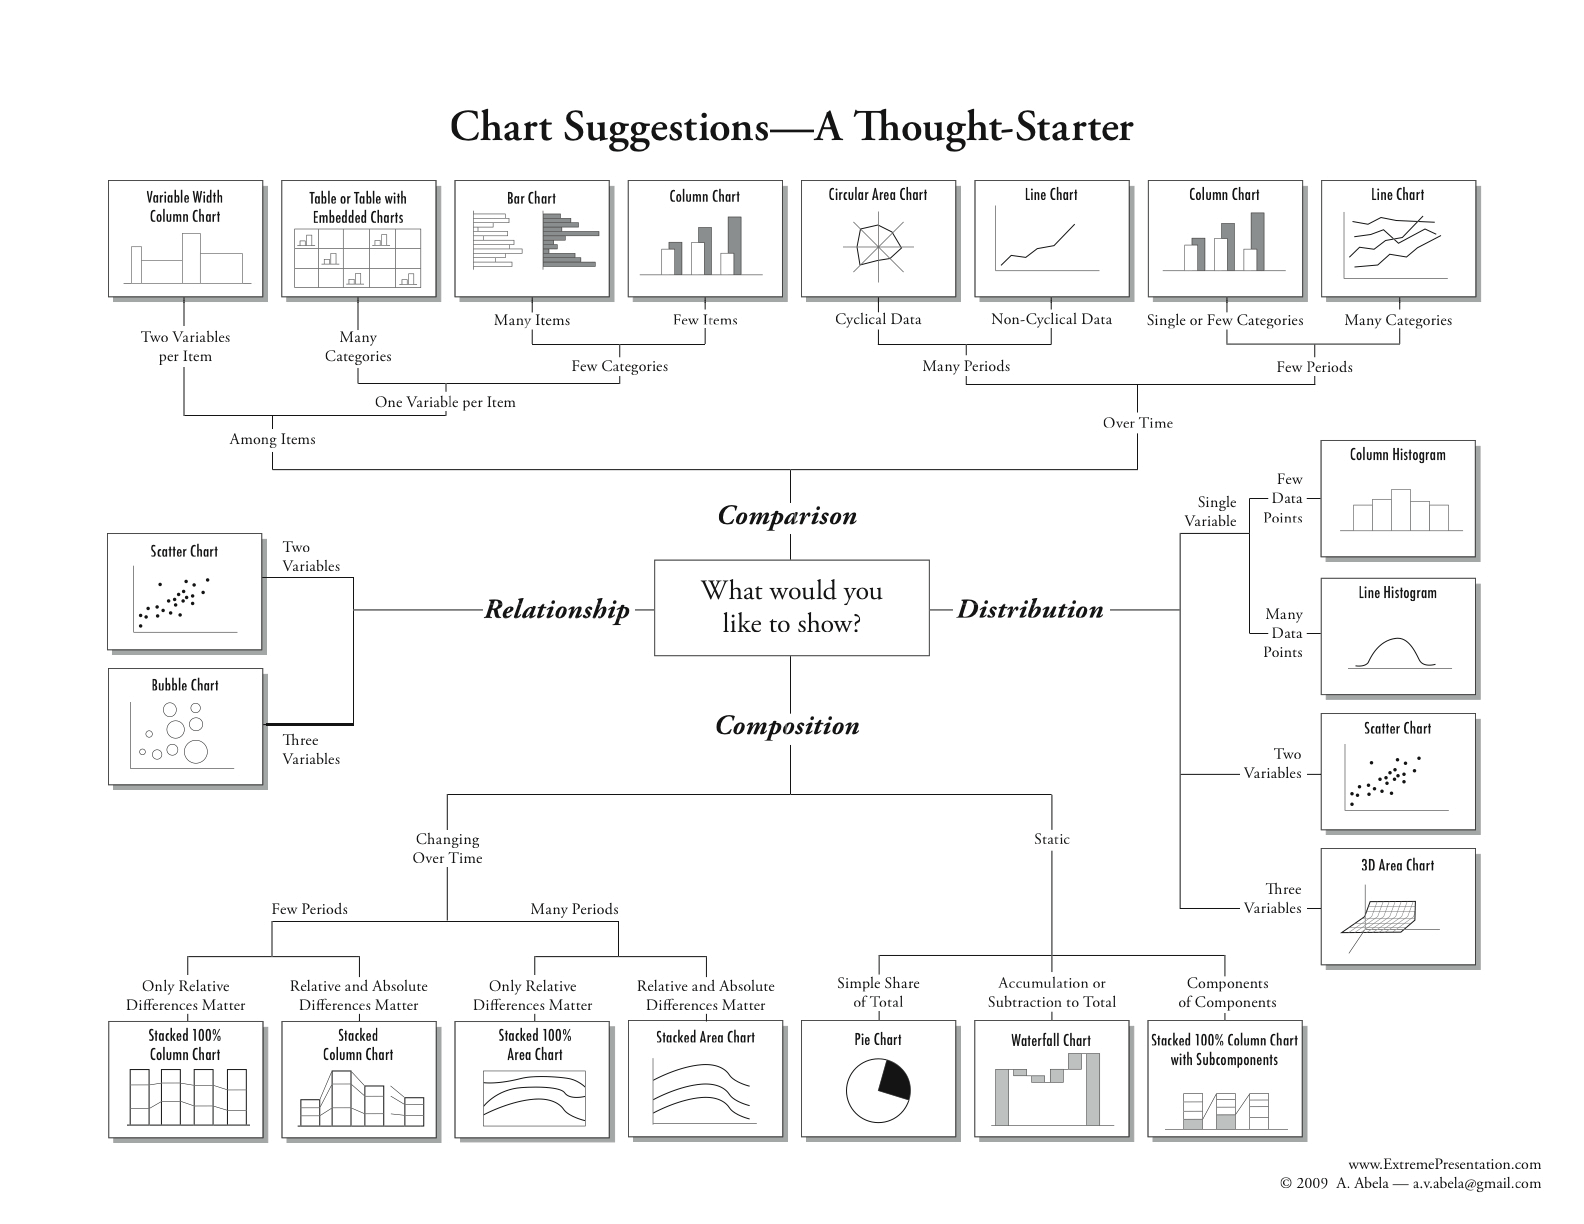
9) Choose the right chart
Always start by asking yourself what story you want to tell. Get clear on the message you want to send and then you can make a decision on which chart communicates it best.
Selecting the right type of visualization accelerates user interpretation and makes your dashboards more useful. Beyond selecting the right type, some nuances improve a chart’s ability to show information.
For example, when using a line chart to display value over time, the unbroken line gives a sense of continuity that a bar chart doesn’t have. Keep experimenting to reach the goal of easily communicating a predetermined story. Below is a kind of “cheat sheet” you can use as a starting point.
10) Use colors
Use colors to draw attention to key metrics or points on your dashboard. Red and green, for example, can quickly visualize whether targets have been reached or not. Don’t use too many colors or they will lose their ability to grab attention – you’ll end up with a colorful dashboard that doesn’t direct attention to what really matters.
11) Use chart titles and descriptions
Chart titles and descriptions can help add context (you can include date ranges or other relevant information) and tell a story. They can help viewers quickly understand what you’re trying to show by presenting particular data in your dashboards. This allows you to summarize chart information in plain English and provide insight faster.
Dashboards with Piwik PRO
With Piwik PRO’s dashboards feature you can apply all the advice given in this article. Constructing boards with drag and drop functionality makes it easy to customize based on the needs of any end user. Plus this way you have your analytics and data visualization tools and in one place.
Conclusion
We hope you’ve found this post useful. Whether you’re a master or just getting started with them, dashboards are a great tool for sharing information with teams and senior management in your organization.
Well-designed dashboards drive action with data analytics and provide added value to your position as a data analyst. In closing, remember that dashboards – beyond looking nice or presenting loads of data – should provide insight to drive action. So try and keep them clean, relevant, and actionable!
For more information or any questions about analytics dashboards feel free to contact us.