

Piwik PRO vs. Matomo (Piwik): The most important differences explained

Piwik PRO and Matomo (formerly Piwik) have a shared history. Some of our employees contributed code for the open-source Piwik project. Early on, Piwik PRO provided enterprise-level support and premium features on top of those open source foundations. In 2016 our paths diverged. We’re now two separate organizations, each with its plans and guiding principles. We realize that although for us this seems obvious, it might not be so from an outsider’s perspective. With this 12-chapter guide, we’d like to adequately explain as much as possible the differences between Matomo and us – both as companies and as products.

No time to read the whole guide at once?
Don’t worry. You can also save it as a handy comparison table.
Chapters


Chapter 1
Piwik PRO vs. Matomo – in a nutshell
This chapter gives you a quick overview of the most important features and characteristics of Piwik PRO (Business and Enterprise) and Matomo (On-Premise and Cloud).

Chapters
- In a nutshell
- Differences between companies
- Differences between products
- Performance & reliability
- Reporting flexibility & customization
- Customer Data Platform
- Data visualization & comparison
- Tracking & reporting traffic sources
- Website performance reports & metrics
- Mobile & app analytics
- Search Console & Google Ads integration
- Support & SLA
- Privacy & security compliance
- Data security
- Which one should you choose?
Choosing the right analytics platform boils down to these six factors:
- Performance & stability – Analytics projects always grow in one way or another. It can happen that your data volume will increase along with traffic and you’ll require more speed. Your analytics platform needs to support these needs.
- Security – Some companies, especially those from highly regulated sectors, must process data according to the highest security standards. This often means using a platform backed up by regular external security audits and hosted on ISO-27001 and SOC 2 certified infrastructure.
- Professional services and customer care – Availability of extensive support, user onboarding and training
- Product use cases, reporting flexibility and integrations – Extra freedom in arranging and using your data as well as advanced integration with external systems (i.e. Google Ads or Google Search Console)
- Privacy compliance – Operating on fully anonymized data or using a product that simplifies compliance
- Price – How much you’re able to invest in a web analytics platform
See how Matomo and Piwik PRO compare to each other:
| Matomo On‑Premise (free) | Matomo Cloud | Piwik PRO Business | Piwik PRO Enterprise | |
|---|---|---|---|---|
| Performance and stability | MySQL backend that requires you to pre-process data in reports based on a large dataset | MySQL backend that requires you to pre-process data in reports based on a large dataset | ClickHouse backend with on-the-fly access to reports based on large sets of data | ClickHouse backend with on-the-fly access to reports based on large sets of data |
| Security | (Last documented security audit in 2014) | (Last documented security audit in 2014) | (ISO 27001 and SOC 2 type II certifications and regular security audits) | (ISO 27001 and SOC 2 type II certifications and regular security audits) |
| Professional services and customer care | (Community forum, help center) | (Email support, 24/7 monitoring) | (Community forum, email support, help center) | (Dedicated implementation, onboarding, training, customer success management, analytics consulting, live-chat support, 24/7 incident handling, SLAs) |
| Number of products | Two (Tag Manager and Web Analytics) | Two (Tag Manager and Web Analytics) | Four (Analytics, Tag Manager, Customer Data Platform and Consent Manager) | Four (Analytics, Customer Data Platform, Tag Manager and Consent Manager) |
| Reporting flexibility and integrations | (Basic Google Ads and Search Console integration, limited customization capabilities) | (Basic Google Ads and Search Console integration, limited customization capabilities) | (Advanced Google Ads and Search Console integration, custom reporting capabilities) | (Advanced Google Ads and Search Console integration, custom reporting capabilities) |
| Privacy compliance features and modules | (GDPR compliant if your server is located in the EU. Features for consent, data anonymization and opt-out) | (No dedicated module for handling consents and user requests, limited anonymization options) | (Integrated consent manager, advanced anonymization features) | (Integrated consent manager, advanced anonymization features) |
If you still have some unanswered questions – keep reading. In the following chapters we’ll give you a more in-depth comparison of the products and the companies behind them.
Chapter 2
Piwik PRO vs. Matomo (Piwik): Differences between companies
Are you wondering how Piwik PRO fares against Matomo from a business perspective? In this section, you’ll learn all the most important facts about the companies.

Chapters
- In a nutshell
- Differences between companies
- Differences between products
- Performance & reliability
- Reporting flexibility & customization
- Customer Data Platform
- Data visualization & comparison
- Tracking & reporting traffic sources
- Website performance reports & metrics
- Mobile & app analytics
- Search Console & Google Ads integration
- Support & SLA
- Privacy & security compliance
- Data security
- Which one should you choose?
Piwik PRO was established in 2013 and since then it has been providing an enterprise-level platform along with support for corporate clients and government organizations. The company has 100+ employees across multiple teams based in the EU and US, dedicated to customer success, technical support, product development, marketing and sales.
Matomo (founded in 2007), on the other hand, is an open-source project. It was formerly known as Piwik until January 2018 when it rebranded. The same people are also the founders of InnoCraft – a consultancy providing premium plugins, cloud hosting and services for Matomo. In 2018, both businesses were merged into one and now appear under the same name (Matomo).
This explains the business relationship between companies. Now, let’s cover the functionalities of each platform.
Get in touch with us and let us walk you through all the functionalities of Piwik PRO Analytics Suite
Chapter 3
Piwik PRO vs. Matomo (Piwik): Differences between products
The differences in the size and scale of the operation between Matomo and Piwik PRO impact their product offer. This section will show you what you can achieve with each software.

Chapters
- In a nutshell
- Differences between companies
- Differences between products
- Performance & reliability
- Reporting flexibility & customization
- Customer Data Platform
- Data visualization & comparison
- Tracking & reporting traffic sources
- Website performance reports & metrics
- Mobile & app analytics
- Search Console & Google Ads integration
- Support & SLA
- Privacy & security compliance
- Data security
- Which one should you choose?
With Piwik PRO Enterprise, you’ll get a fully-integrated Analytics Suite, consisting of:
- Analytics (used for Analytics for web and mobile, Analytics for product teams)
- Tag Manager
- Customer Data Platform (CDP)
- Consent Manager
With Piwik PRO you can use integration with Google Tag Manager to collect data server-side and client-side.
Piwik PRO Analytics Suite offers wide possibilities for collecting and activating data. In addition to standard analytics, it also lets you:
- Perform data integration across marketing, sales and customer success tools and platforms. Easily integrate data using webhooks and automation tools.
- Tie up visitor data scattered across channels and touchpoints into unified single customer view
- Connect siloed data sources into clear records to map the customer journey
- Segment your clients and visitors based on any conditions, including demographic and behavioral data and build detailed audiences
- Activate collected data through on-site retargeting (via your tools), remarketing, personalized emails and other communication channels.
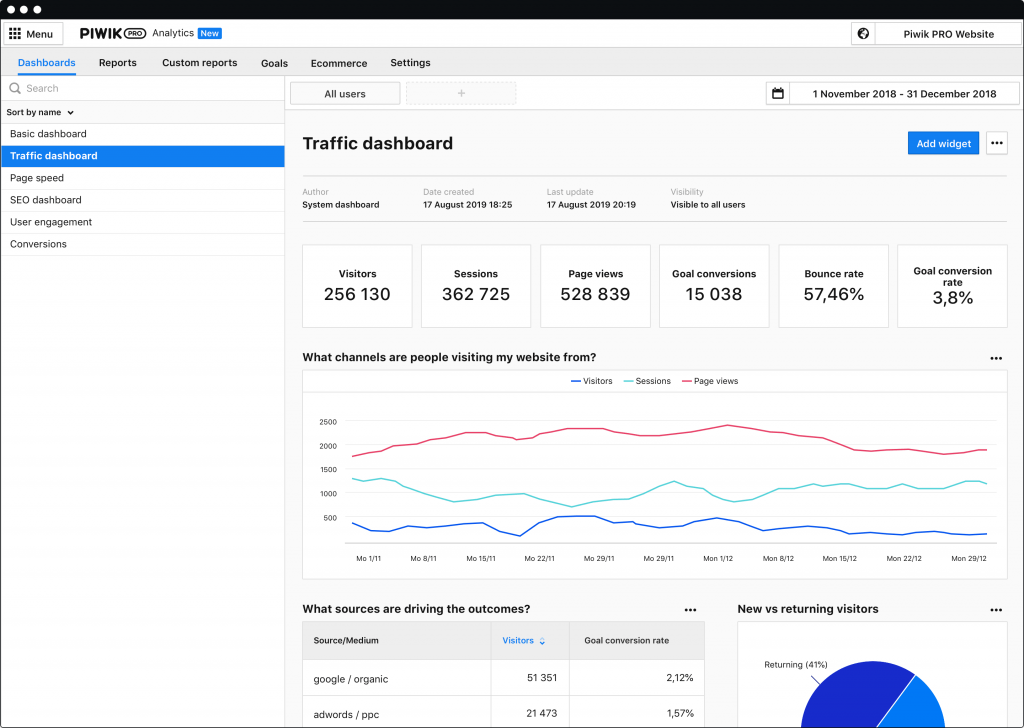
Here’s how Piwik PRO user interface looks like:
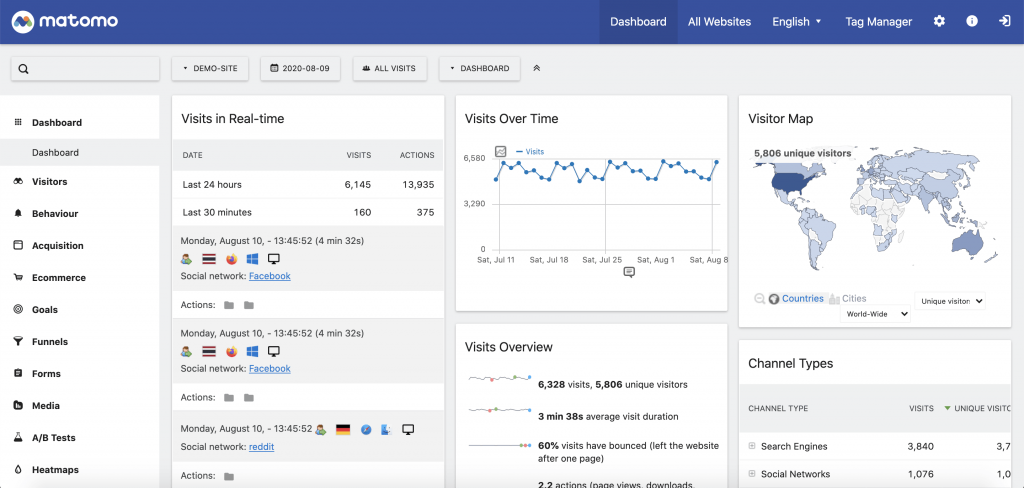
Here’s how Matomo user interface looks like:
Standard analytics features
While both platforms allow users to operate on unsampled data, Piwik PRO lets their high-traffic clients employ data sampling on request. This means that even clients whose websites experience over a billion actions per month can enjoy fast and smooth access to their data.
Other product characteristics worth mentioning in this context are:
- Availability of a unique visitor metric. In Matomo, you can use it only for selected reports and for websites with low traffic. Also, the metric can’t be applied to custom date ranges.
- Number of custom dimensions. In the case of the free Matomo On-Premise, there are 5 by default and more if you manually extend the schema database. In Matomo Cloud, the upper limit is 15. At the same time, with Piwik PRO Business and Enterprise you get 25 custom dimensions. The Enterprise plan users can also count on a dedicated account manager who will help you set up additional dimensions.
- Number of websites. It’s unlimited in Piwik PRO Enterprise and Matomo On-Premise. Piwik PRO Business allows for tracking up to 10 websites, while Matomo Cloud maxes out at 30.
- Number of segments. Matomo On-Premise allows its users to create any number of segments, but each of them has to be precalculated. That impacts the speed of report creation. Matomo Cloud’s limit is 100 segments, while Piwik PRO offers unlimited segments paired with a fast backend (we tackle this issue in the next section).
- Availability of calculated metrics. This means unique metrics you can create from existing metrics. You’ll find them in Piwik PRO, while Matomo lacks this functionality.
| Matomo On‑Premise (free) | Matomo Cloud | Piwik PRO Business | Piwik PRO Enterprise | |
|---|---|---|---|---|
| No data sampling by default | ||||
| Possibility to enable data sampling for high-traffic properties | ||||
| Custom dimensions | 5 for each scope by default, more on request | 15 for each scope | 25 for each scope by default | 25 for each scope by default, more on request |
| Website performance metrics | ||||
| Unique visitor metric available for different reports and time ranges | ||||
| Number of websites | unlimited | 30 | 10 | unlimited |
| Number of segments | unlimited | 100 | unlimited | unlimited |
| Calculated metrics |
Chapter 4
Performance & reliability
Analytical processes call for different ways to access data, making use of complete sets, and applying convenient methods to analyze data. And the speed of creating reports is crucial. The faster the analytics backend, the sooner you’re able to analyze the data set. In this chapter, we’ll talk about performance and reliability of each platform.

Chapters
- In a nutshell
- Differences between companies
- Differences between products
- Performance & reliability
- Reporting flexibility & customization
- Customer Data Platform
- Data visualization & comparison
- Tracking & reporting traffic sources
- Website performance reports & metrics
- Mobile & app analytics
- Search Console & Google Ads integration
- Support & SLA
- Privacy & security compliance
- Data security
- Which one should you choose?
ClickHouse, a column-oriented database management system power Piwik PRO’s backend. With this engine, our analytics became more scalable and efficient, even when it’s used in big analytics projects where traffic exceeds a billion actions per month. Equipped with a new engine, the module:
- Cut down pre-computing time needed to process data (you can read about it here)
- Made our analytics more scalable and efficient (it is now able to handle over 500 million events per month)
- Improved the overall usability of our product (the user interface now includes a simple drag and drop editor allowing you to mix and combine metrics, dimensions and events to create and filter reports)
- Increased the variety of data visualization methods (e.g. nested tables and numerous types of line and bar charts)
All of that allowed our customers to overcome some reporting limitations.
Matomo, due to its software based on PHP and a row-oriented MySQL database, needs additional time to pre-process data, especially when medium or high traffic is involved. According to the FAQ section of its website:
For example, using version 1.3 on a single core duo2 server with 3GB of ram, Matomo archiving process takes about 2 hours for 500,000 pages per day (and more than 1,000 websites).
This impacts not only the speed of data processing. It also influences the platform’s feature set, as some analytics functionalities rely heavily on data processing efficiency. We’ll discuss this issue later on.
If you want to read more about Matomo’s performance, be sure to check this blog post: Matomo performance issues: What causes them and how to fix them
In Piwik PRO reports based on the same (or much bigger) data sample would be generated immediately.
Data retention
Now let’s talk about data retention. With Matomo On-Premise, you can set these properties yourself, while Matomo Cloud retains user data for 6 to 24 months, depending on the plan.
Piwik PRO gives you more flexibility. In the Enterprise plan, by default, you’re granted 25 months of data retention that you can also extend if needed. The Business plan offers fixed 25-month data retention.
| Matomo On‑Premise (free) | Matomo Cloud | Piwik PRO Business | Piwik PRO Enterprise | |
|---|---|---|---|---|
| Reporting backend | obsolete / MySQL | obsolete / MySQL | modern / ClickHouse | modern / ClickHouse |
| Data processing | preprocessing required | preprocessing required | on the fly | on the fly |
| Generating reports based on high traffic volume | 2 hours or more | 2 hours or more | on the fly | on the fly |
| Data retention | customizable | 6-24 months | 25 months | 25 months or more, depending on your contract in the Enterprise plan (cloud, private cloud) |
Chapter 5
Reporting flexibility & customization
While standard reports can still be helpful, custom reports allow you to tailor the dataset to your business case and make the most of the analytics data you have. In this section, we’ll show you what Piwik PRO’s and Matomo’s custom reports look like.

Chapters
- In a nutshell
- Differences between companies
- Differences between products
- Performance & reliability
- Reporting flexibility & customization
- Customer Data Platform
- Data visualization & comparison
- Tracking & reporting traffic sources
- Website performance reports & metrics
- Mobile & app analytics
- Search Console & Google Ads integration
- Support & SLA
- Privacy & security compliance
- Data security
- Which one should you choose?
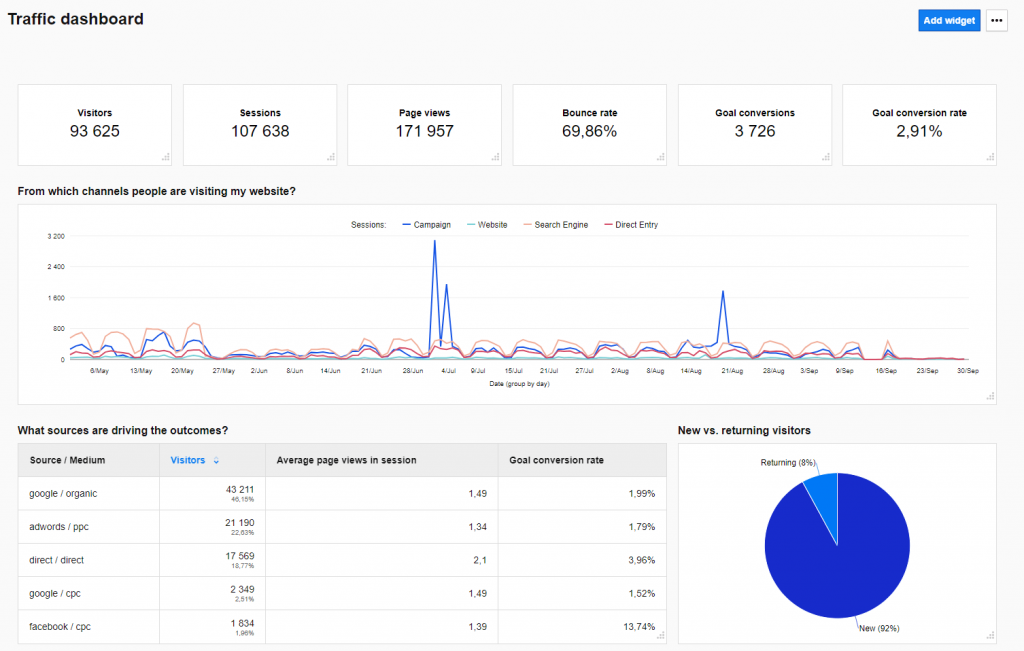
With Piwik PRO (in both Business and Enterprise plans), you can customize almost every piece of reporting, whether it’s a default report, dashboard, or a widget. Adding, removing, and editing metrics, dimensions, columns, or even whole charts takes just a few clicks.
Each report has a Customize button as a handy way to apply changes.
Then, you can easily customize reports by filtering out traffic or using segmentation. You’ll see applied filters and segments each time you use the report, so you won’t have to set them up again.
Most importantly, you can tailor any default report to your own preferences – add or remove KPIs according to your business case.
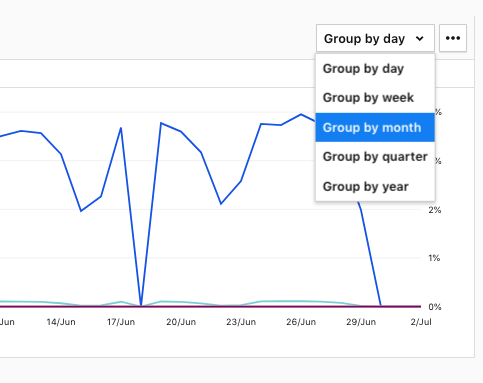
You can also adjust the time span for which data is grouped on each chart. This is crucial in uncovering seasonality and spotting trends across extended time periods like weeks, months, quarters or years.
None of this can be achieved with Matomo. It doesn’t allow you to customize default reports or to group the data on charts. 80% of default reports are missing data visualization features or charts.
| Matomo (On-Premise & Cloud) | Piwik PRO (Business & Enterprise) | |
|---|---|---|
| Customizing default reports | ||
| Grouping data presented on charts |
Flexibility of dashboards
You can tailor almost every element of Piwik PRO dashboards. Just add or remove analytics bits and pieces as needed.
Instead of using ready-made templates, you can:
- Change the size and dimensions of each widget on the dashboard – there’s no need to stick to a 2-, 3- or 4-column layout
- Mix widgets on your dashboard in whatever order you like
Matomo’s dashboards don’t give you this flexibility. You can only choose from a few available dashboard layout templates:
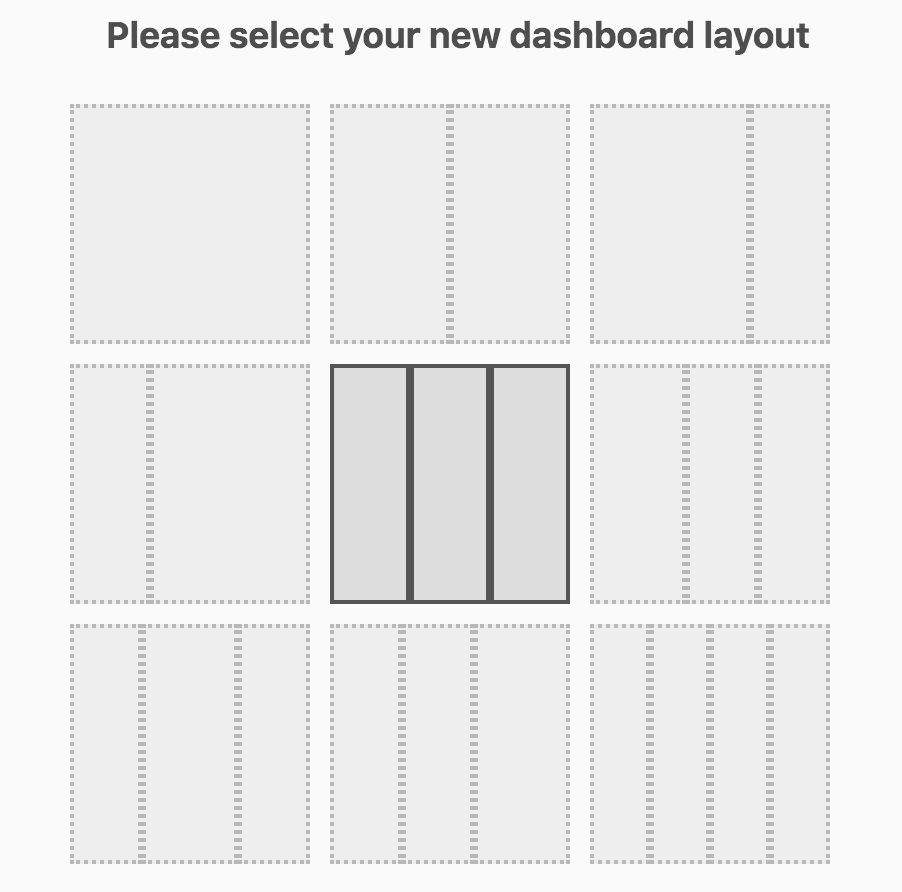
You can’t add desired metrics and dimensions, and the dashboard can only consist of pre-made widgets. Also, their size and dimensions are fixed.
Individual KPI & metrics widgets
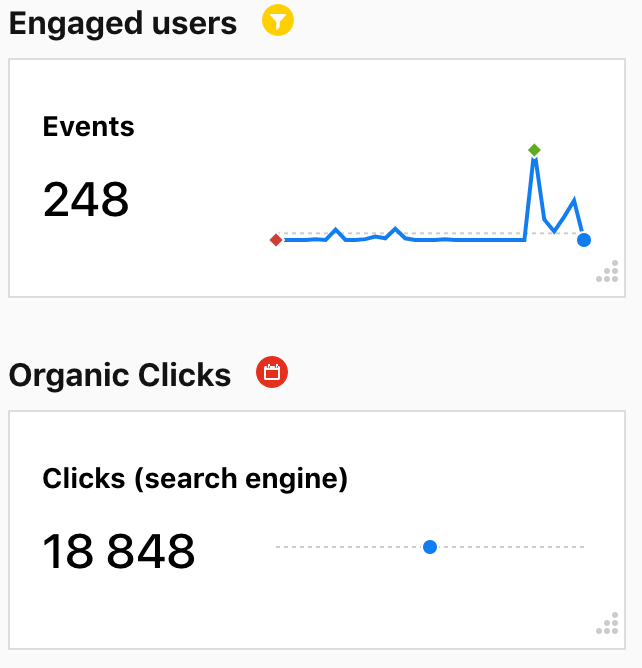
In Piwik PRO you can use individual metrics as separate widgets. This way you can build a whole dashboard using only the essential KPIs and metrics.
On top of that, you can expand each metric widget with a timeline or trend spark line that visualizes KPI changes over time.
Matomo’s dashboards give you less flexibility. You can only use a bundled set of metrics. This means, for example, that if you want to create a widget with visitor-related data, it has to contain all the metrics concerning that subject. There’s no way of building dashboards around individual metrics and KPIs.
Also, you can add trend spark lines only as a part of a widget consisting of many other metrics.
Segmenting & filtering metrics
With Piwik PRO you can attach a filter or segment to each of the metrics from the dashboard.
Also, you can narrow down the displayed KPIs to a certain audience or filter out traffic for which a given KPI should be visible. Just attach a filter or segment to each metric and it’s done.
You can’t do those things with Matomo. Using their tools, you can only apply segments to a whole dashboard, not its individual parts such as widgets or metrics. This means, for example, that your dashboard can’t include widgets based on two different segments. And each time you refresh the dashboard, the segments will disappear and you will have to configure them again.
Widget types, charts & diagrams
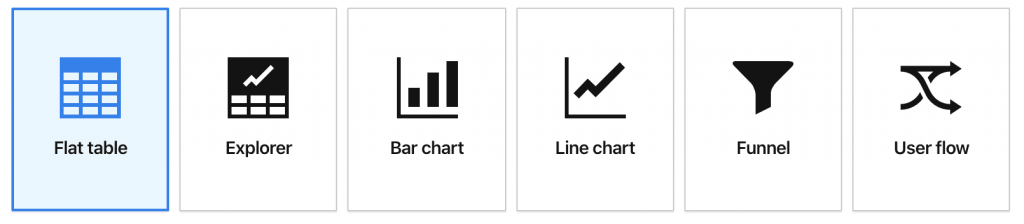
Now for data visualization features. In Piwik PRO, you can choose from six different types – flat table, explorer, bar chart, line chart, user flow and funnels.
Also, what’s particularly helpful, you can build custom charts for your dashboards using metrics and dimensions of your choosing.
And you can build custom tables using whatever composition of metrics and dimensions you like.
In Matomo, there is no way to create your own custom table and then add it to the dashboard. Also, you can’t present a specific piece of data in the form of a chart or diagram – all these things are already preconfigured.
There are also important differences concerning funnel and user flow reports:
Funnel analytics
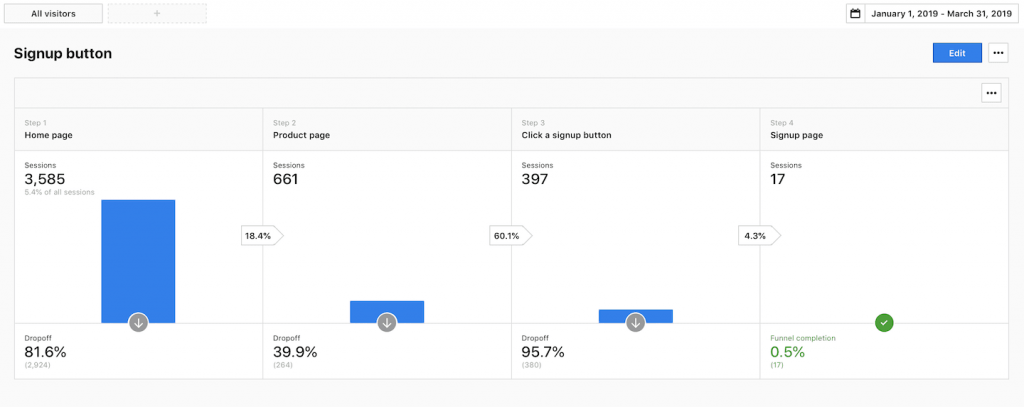
In Piwik PRO, you can build funnels out of any type of page view and custom event. In addition, funnels are:
- Retroactive – present historical data tracked before the funnel was defined
- Available immediately after creation
- Flexible – don’t require a goal as a last step
- Filtrable – allow you to define each step in the funnel at a highly granular level
No matter when you decide to configure your funnel, you’ll always have access to the full dataset of both historical and recent user actions.
Matomo’s funnels are a paid plugin, available as a standard feature in the Cloud pricing plans. They:
- Can be based on only page URLs
- Require you to set up goals
- Can’t show historical data by default (to enable it you have to validate the historical data, and then re-process the reports for all your websites)
- Need additional time to calculate the data (because of its backend efficiency)
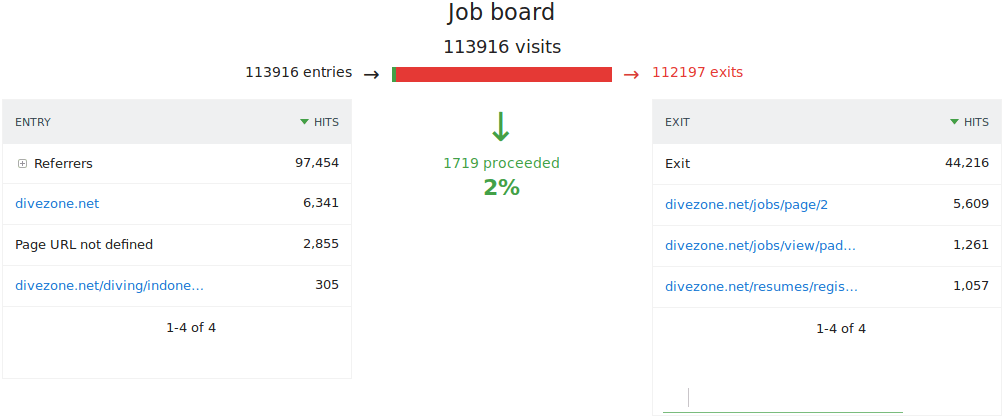
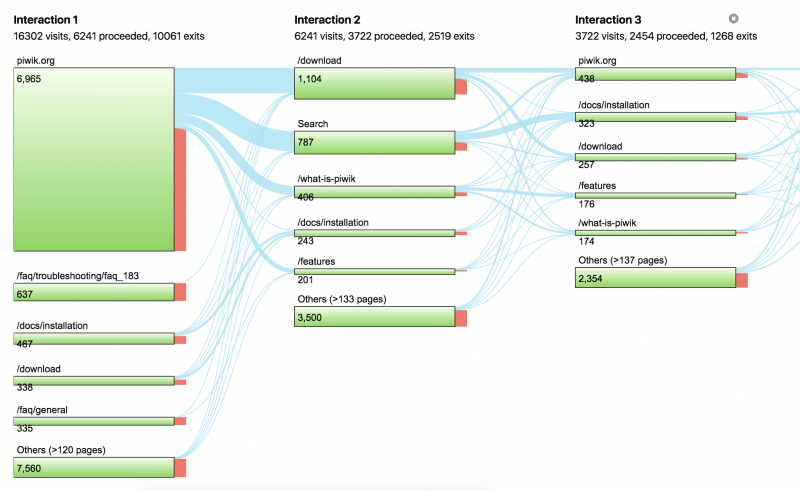
User flow reporting
Piwik PRO’s user flow reports provide you with the following options:
- To set up a user flow report for interactions such as a page view, download, search, custom event, and more
- To see a breakdown of dimensions related to sessions. For example, you can view channels, referrers or campaigns
- To add up to five previous and next interactions
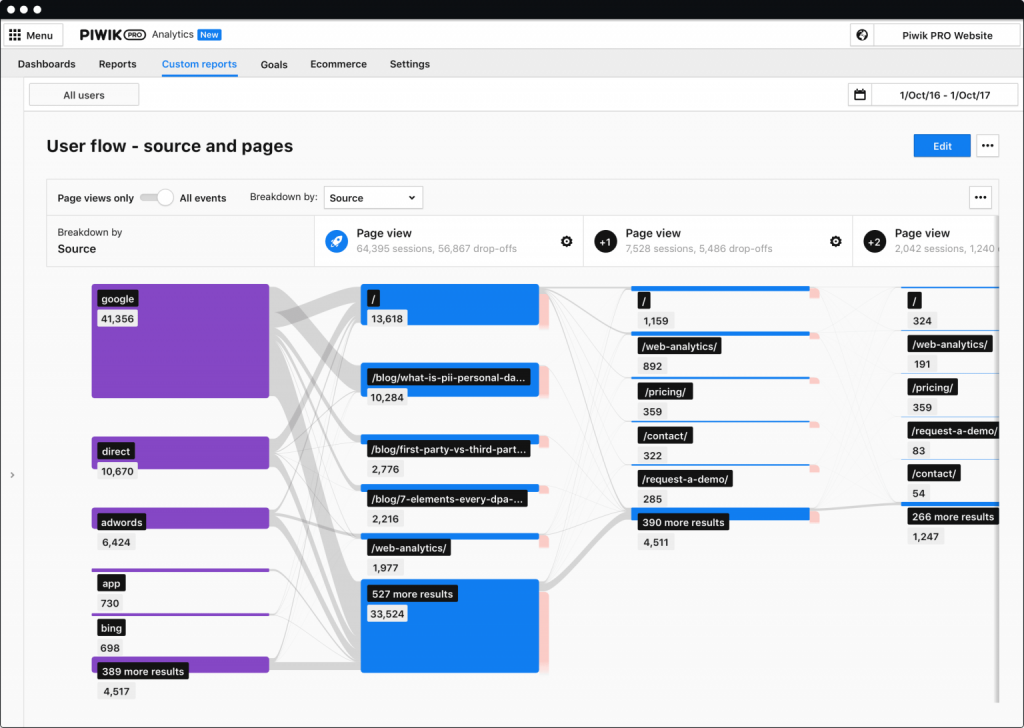
The user flow in Piwik PRO has three settings that help you analyze visitor paths:
- Standard: shows you the next interactions after the key interaction.
- Transition: illustrates the interactions before and after the key interaction.
- Reverse: shows you the interactions preceding the key interaction.
As for Matomo, users flow is a paid plugin, available in the Marketplace as a yearly subscription and as a part of the Matomo Cloud offer. It allows you to take advantage of one type of report (standard user flow), based only on page views.
Multi-channel attribution
Both Piwik PRO and Matomo give multi-channel attribution tools that help you analyze the customer journey and assign conversions to the right channel.
However, with Matomo those tools are available only as a paid plugin. Also, the platform doesn’t allow you to create custom attribution models and custom attribution reports or use custom channel grouping in the reports visualizing conversion paths.
All of that is available in Piwik PRO.
| Matomo On‑Premise (free) | Matomo Cloud | Piwik PRO Business | Piwik PRO Enrerprise | |
|---|---|---|---|---|
| Funnel analytics | paid plugin / | |||
| User flow | paid plugin / | |||
| Line chart | ||||
| Explorer | ||||
| Bar chart | ||||
| Flat table | ||||
| Custom dashboards | ||||
| Custom reports | paid plugin / | |||
| Ability to customize any default report | ||||
| Ability to create custom visualization | ||||
| Filtering data | ||||
| Custom metrics & dimensions for each report | ||||
| Custom data grouping | ||||
| Advanced drag & drop editor | ||||
| Custom data filters & segments to each widget | ||||
| Custom attribution models | ||||
| Custom attribution reports | ||||
| Custom channel grouping in conversion path reports | ||||
| Path length report | ||||
| Time to conversion report | ||||
| Attribution model comparison tool | paid plugin |
Piwik PRO offers everything Matomo does – plus more – with its built-in CDP, extending beyond Analytics to data activation and deeper customer insights.
Chapter 6
Customer Data Platform
Customer data platforms (CDP) help you achieve a unified and comprehensive view of your customers, giving you tools to improve personalization and marketing campaign effectiveness. With a CDP, you can effortlessly integrate data from different sources to build in-depth customer profiles that include all the data you’ve gathered, such as demographic information, purchase history, behavioral data, etc.

Chapters
- In a nutshell
- Differences between companies
- Differences between products
- Performance & reliability
- Reporting flexibility & customization
- Customer Data Platform
- Data visualization & comparison
- Tracking & reporting traffic sources
- Website performance reports & metrics
- Mobile & app analytics
- Search Console & Google Ads integration
- Support & SLA
- Privacy & security compliance
- Data security
- Which one should you choose?
Piwik PRO offers everything Matomo does – plus more – with its built-in CDP, extending beyond Analytics to data activation and deeper customer insights.
Piwik PRO Customer Data Platform
Piwik PRO provides a dedicated CDP designed to integrate, segment, and activate first-party data across multiple platforms. With Piwik PRO, you can use an all-in-one integrated data platform that includes Analytics, Tag Management, Consent Management, and Customer Data platform. Unlike other CDPs that rely on external data imports, Piwik PRO offers built-in integration between its CDP and Analytics, enabling seamless access to raw demographic and behavioral data without additional APIs or connectors. Key features include:
- Data integration: Seamlessly import data from CRMs, ecommerce platforms, data warehouses, and other tools using incoming webhooks and automation platforms. This integration enriches customer profiles with external data, offering a comprehensive view of user behavior and preferences.
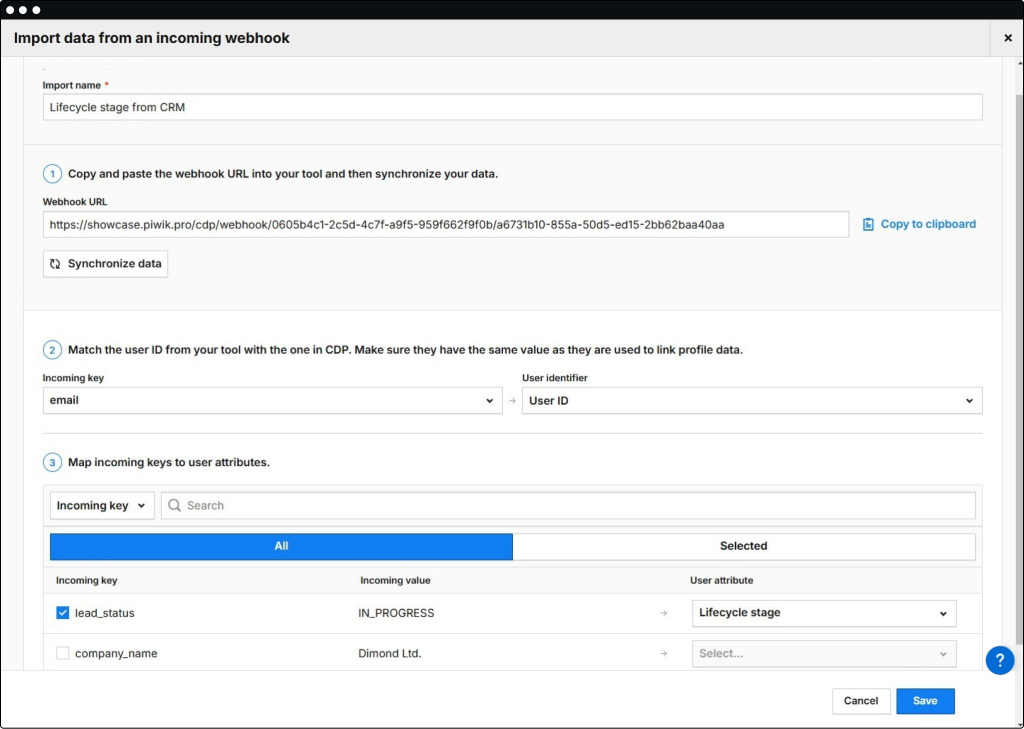
Learn more about Piwik PRO CDP and integrations:
- Single customer view: Consolidate visitor data from multiple touchpoints into single customer views, providing detailed insights into user characteristics and interactions.
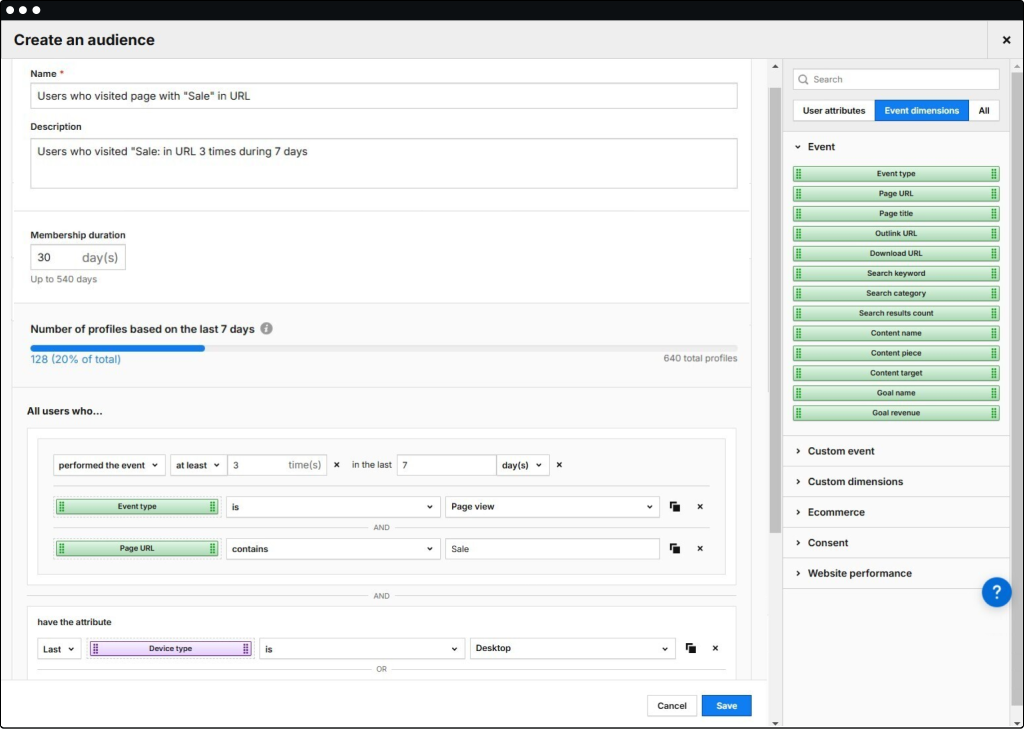
- Audience segmentation: Define custom audiences based on user attributes and behaviors, enabling targeted marketing campaigns and personalized content delivery.
Piwik PRO’s Customer Data Platform (CDP) enhances personalization by unifying customer data from a range of sources into comprehensive profiles. Consolidating this data gives businesses a holistic view of their customers, enabling them to develop precise audience segments based on behaviors, preferences, and demographics. Companies can utilize this data to deliver personalized messages and experiences across multiple channels in real-time, ultimately improving customer acquisition, engagement, and retention.
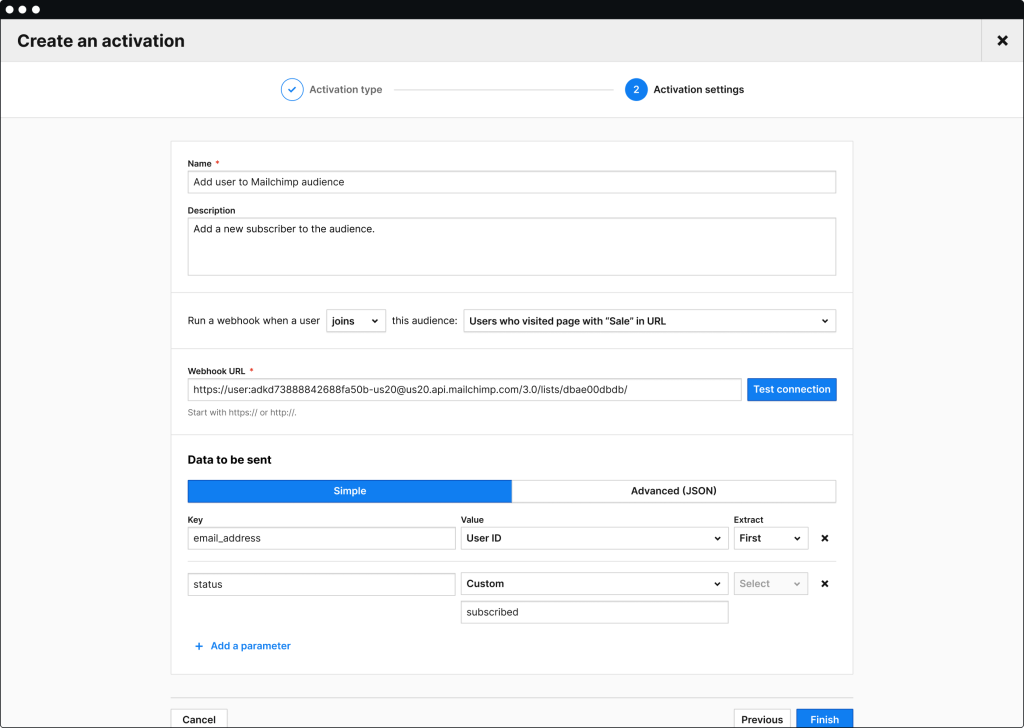
- Data activation: Activate data by sending selected attributes to various destinations through webhooks and automation tools, including CRM systems, ad platforms, and email marketing tools.
If you want to learn more about data activation, read Unlock the power of customer data: A Piwik PRO data activation playbook
- Privacy compliance: Store data in public or private clouds, including EU-owned data centers, to ensure compliance with global privacy laws such as GDPR, CCPA, HIPAA and others.
Matomo’s approach to customer data management
While Matomo doesn’t offer a standalone CDP, it provides functionalities that can be utilized for customer data management:
- Data aggregation: Matomo collects and organizes user data across various touchpoints on the website, creating individual visitor profiles and aggregated reports. However, there is no option to enrich Matomo profiles with data from external systems.
- Integration capabilities: Matomo allows integration with other software and systems through APIs, enabling exports of raw user and interaction data to external CDPs or Business Intelligence tools.
- Privacy features: Matomo emphasizes data ownership and privacy, offering options for cookieless tracking and compliance with privacy regulations.
Key differences
- Dedicated CDP: Piwik PRO offers a dedicated Customer Data Platform with native features for data integration, unified customer profiles, audience segmentation, and data activation – all at no cost. In contrast, Matomo provides data collection and integration tools but relies on external systems for comprehensive CDP functionalities.
- Data activation: Piwik PRO’s CDP facilitates direct data activation through integrations with various marketing and communication platforms. Matomo requires additional configurations or external tools to achieve similar data activation capabilities.
- Privacy compliance: Both platforms prioritize user privacy and data ownership. Piwik PRO offers flexible hosting options, including EU-owned data centers, to ensure compliance with global privacy laws. Matomo also provides privacy-focused features, such as cookieless tracking and data anonymization, to meet regulatory requirements.
Advanced user segmentation
Matomo and Piwik PRO differ significantly in their approach to user segmentation, particularly in how data can be activated. While both platforms allow segmentation based on first-party data, Piwik PRO enables segmentation across multiple systems and beyond single-visit interactions.
With Piwik PRO, users can be segmented based on engagement metrics like email open counts or interactions over a defined period (e.g., the last three days). This ability to measure interest levels and recency allows immediate data activation—acting on fresh, relevant insights while user interest is still strong.
In contrast, Matomo provides user profiles and historical segmentation but lacks real-time activation capabilities. While data can be analyzed and used for future insights, it cannot be easily accessed for engagement based on recent behavior.
With its robust data activation capabilities, Piwik PRO is an ideal Customer Data Platform for organizations seeking a comprehensive, integrated solution. Conversely, Matomo offers essential data collection and integration features suitable for businesses that prefer to manage customer data using external systems or have basic data management needs.
If you want to learn more about data activation and customer data platforms, read:
- Activate data for a personalized customer experience with the Piwik PRO Customer Data Platform
- Customer Data Platform: Generate meaningful insights with customer data activation and import
- Free comparison of 7 enterprise-ready customer data platforms
- 8 customer data platform (CDP) use cases that will drive your business growth
Explore our videos:
Interested in integrating and activating your first-party data with a privacy-friendly Customer Data Platform?
Chapter 7
Data visualization & comparison
In this chapter we will discuss the flexibility in compiling and presenting data. It’s crucial for analysts and marketers to have a decent selection of visualization features and display the data in a clear and informative way. Here’s what Piwik PRO and Matomo offer in this field.

Chapters
- In a nutshell
- Differences between companies
- Differences between products
- Performance & reliability
- Reporting flexibility & customization
- Customer Data Platform
- Data visualization & comparison
- Tracking & reporting traffic sources
- Website performance reports & metrics
- Mobile & app analytics
- Search Console & Google Ads integration
- Support & SLA
- Privacy & security compliance
- Data security
- Which one should you choose?
Piwik PRO gives you with three types of charts – line, pie and column – that you can turn into:
- Clustered column charts – showing values of multiple category groups
- Grouped bar charts – letting you compare values of multiple categories across multiple dimensions
- Stacked bar charts – visualizing traffic composition depending on the device type used by the user – in other words putting the whole custom report into a single chart
- Multi-line charts – especially useful for comparing data from specific time periods and values over time
For even greater flexibility, you can integrate Piwik PRO with data visualization tools – such as Power BI or BigQuery.
Matomo Analytics provides you with a set of visualizations consisting of: tables, nested tables, line charts, multi-line charts, bar graphs, pie charts, and cloud charts. And with Matomo Custom Reports you’ll get to choose between other graph types such as:
- Table: showing the report data in a typical Matomo (Piwik) data table
- Evolution: a graph showing the evolution for the selected metrics over time (also known as a line graph)
- Plus, the visualizations from standard Matomo analytics
| Matomo Analytics | Matomo Custom Reports Plugin | Piwik PRO (Business & Enterprise) | |
|---|---|---|---|
| Tables | |||
| Nested tables | |||
| Line charts | |||
| Multi-line charts | |||
| Bar graphs | |||
| Pie chart | |||
| Cloud chart | |||
| Clustered column charts | |||
| Grouped bar charts | |||
| Stacked bar chart | |||
| Customizable graph templates | |||
| Easy integrations with BI tools (e.g. Looker Studio, Power BI) |
* only a manual integration with Looker Studio available
**Looker Studio available only via a third-party tool
Chapter 8
Tracking & reporting traffic sources
One of the most important functionalities of analytics from a marketer’s standpoint is reporting on traffic sources. With it, you know where your users are coming from and can analyze the results of your marketing campaigns. In this section, you’ll learn what Piwik PRO and Matomo have to offer regarding campaign reporting.

Chapters
- In a nutshell
- Differences between companies
- Differences between products
- Performance & reliability
- Reporting flexibility & customization
- Customer Data Platform
- Data visualization & comparison
- Tracking & reporting traffic sources
- Website performance reports & metrics
- Mobile & app analytics
- Search Console & Google Ads integration
- Support & SLA
- Privacy & security compliance
- Data security
- Which one should you choose?
In Matomo, there is an open plugin called Marketing Campaigns Reporting. It allows you to see the following data:
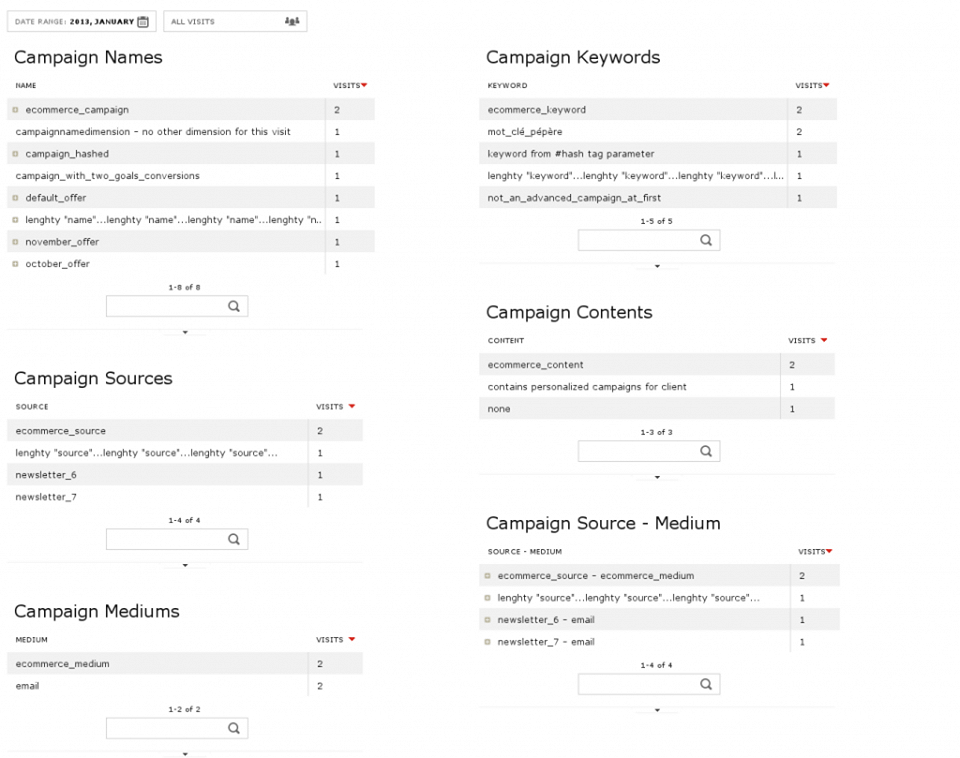
The most important dimension for traffic reporting – source/medium – is available only for campaign reports. You won’t be able to use it in reports on traffic from particular browsers or websites – also important for examining your traffic sources.
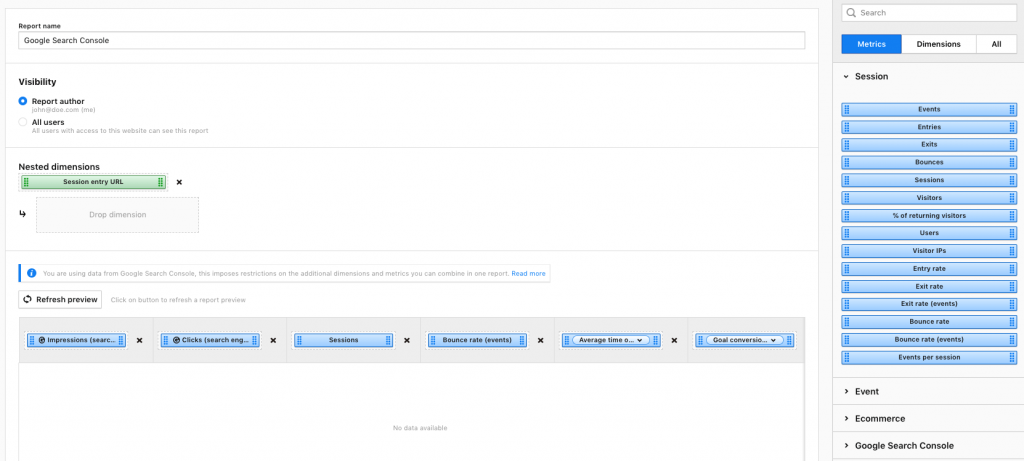
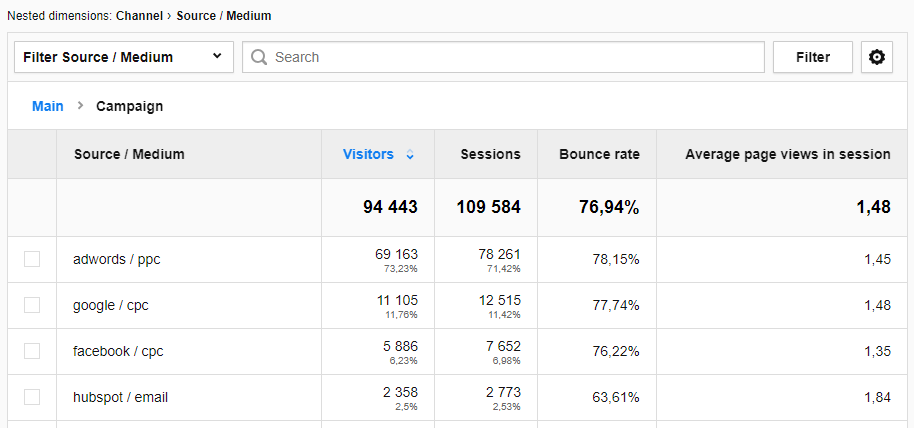
In Piwik PRO, you can create a report with your own set of metrics and dimensions, so adding a source/medium dimension to the above-mentioned reports (or virtually any other report) won’t be any problem:

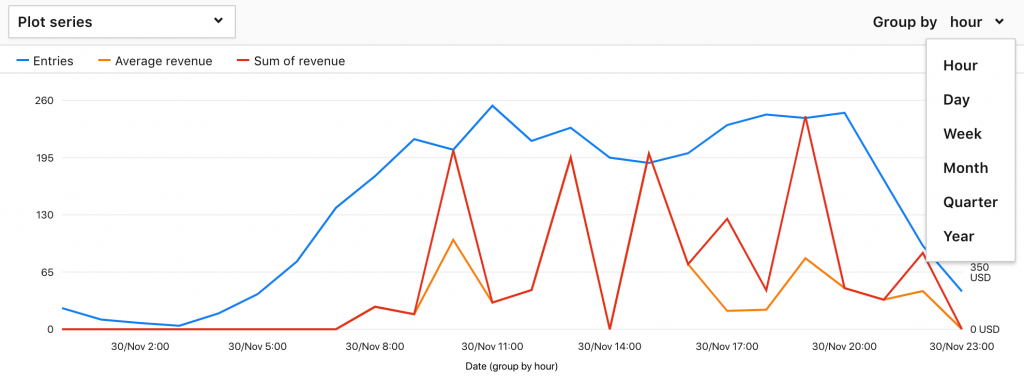
Also quite helpful: the report can be enriched with a multi-line chart showing you the effectiveness of traffic sources over time. Thanks to the fact that the table can be nested, the information is easy to arrange in a user-friendly manner.
For instance, if you click on Campaigns dimension, you’ll see the following data:
The metrics and dimensions visible in the report can be matched to your personal preferences.
Learn more about the benefits you can gain by partnering with Piwik PRO Analytics Suite
We’re here to answer all your questions!
Chapter 9
Website performance reports & metrics
Performance metrics allow you to measure how your website or product behaves on different browsers, devices, operating systems and for different segments of users. It’s about investigating how users interact with your product. You look for the types of reports that best answer your questions. Here’s how Piwik PRO and Matomo compare in that context.

Chapters
- In a nutshell
- Differences between companies
- Differences between products
- Performance & reliability
- Reporting flexibility & customization
- Customer Data Platform
- Data visualization & comparison
- Tracking & reporting traffic sources
- Website performance reports & metrics
- Mobile & app analytics
- Search Console & Google Ads integration
- Support & SLA
- Privacy & security compliance
- Data security
- Which one should you choose?
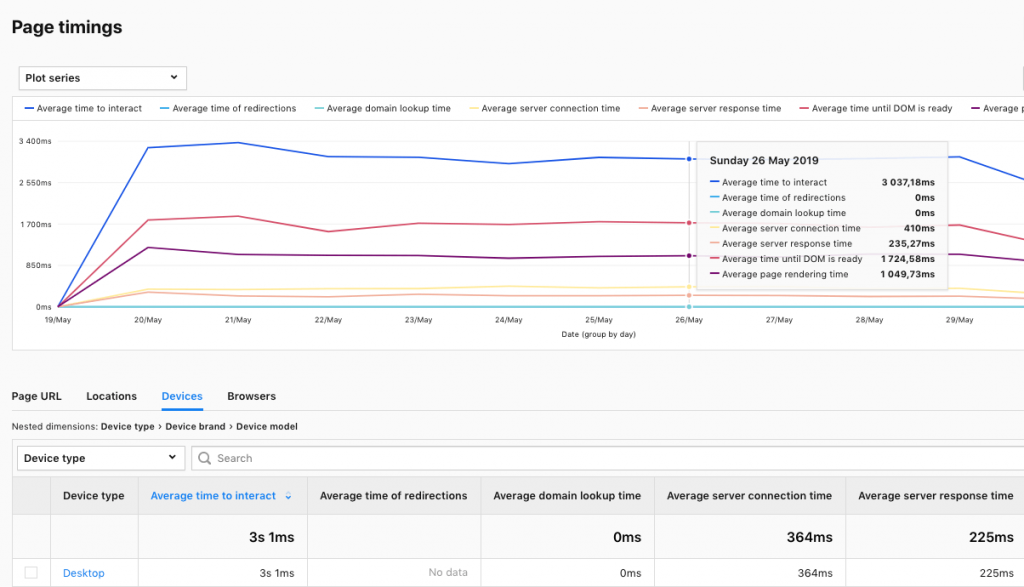
In Piwik PRO (in both Business and Enterprise plans), you can take advantage of default performance-related reports or create custom reports based on dedicated metrics. Here’s a list of the key metrics for understanding page load speed:
- Page generation time
- Time until DOM is ready
- Time to interact
- Time of redirections
- Domain lookup time
- Server connection time
- Server response time
- Page rendering time
And here is a sample report based on those metrics:
As for Matomo, right now it offers one performance-related metric called average generation time. However, it doesn’t present how fast the website loads for different connection qualities or devices. The metric refers only to the communication time between the browser and the page server.
In Piwik PRO there’s a time to interact metric that shows how different users experience website loading speed.
Chapter 10
Mobile & app analytics
Mobile and app analytics lets you collect behavioral data about users who browse your website or app on their mobile devices. You can discover a user’s needs and track the complete click paths. Such insights can help you personalize content, improve user experience, and measure retention.

Chapters
- In a nutshell
- Differences between companies
- Differences between products
- Performance & reliability
- Reporting flexibility & customization
- Customer Data Platform
- Data visualization & comparison
- Tracking & reporting traffic sources
- Website performance reports & metrics
- Mobile & app analytics
- Search Console & Google Ads integration
- Support & SLA
- Privacy & security compliance
- Data security
- Which one should you choose?
Tracking mobile apps is different from collecting data about websites. It calls for specialized tools, as well as employing software development kits (SDKs).
With Piwik PRO and Matomo, you may take advantage of the mobile SDK (iOS, Android, Flutter, React Native) to analyze user engagement and ensure a smooth experience with your app.
In Matomo, only iOS and Android SDKs are officially published and supported. Other SDKs, like React Native or Flutter, are community-made and rarely updated. For example, the last update for the React Native Matomo SDK was in March 2021.
The SDKs of both platforms let you track screen views, events, searches made within your app search engine, custom dimensions, user ID, goals, and ecommerce interactions. But there are some differences.
Significant differences between Matomo and Piwik Pro SDKs:
- There are no data anonymization options in Matomo (such as anonymous tracking or opt-out).
- Matomo SDKs offer only session-scoped custom dimensions (no event-scoped dimensions).
- Piwik PRO has better support for acquisition reports than Matomo, including campaign attribution and support for deep links (links that lead to the app from a website).
- Matomo SDKs don’t support content tracking (content impressions and content interactions). It is possible with Piwik PRO to track the ad impressions in your application and get insights into how your audience watches your videos and listens to your audio.
- With Piwik PRO, you can track search engine keywords and how they’re used in search inside your application. This feature is not available in Matomo.
- Matomo’s documentation concerning SDKs is often insufficient and confusing, like here.
- Matomo’s iOS and Android SDKs differ since they were developed separately. You have to put a lot of effort into implementing both.
Learn more about mobile SDKs
Single-page websites and progressive web apps have become a standard over the last few years. Getting their tracking right is crucial to your success, as you must ensure the measured data is meaningful and correct. Both Piwik PRO and Matomo offer these functionalities.
You can set up accelerated mobile pages (AMP) with Piwik PRO. It is an open-source framework designed to optimize browsing on mobile devices. This technology can render static content pages much faster than traditional methods. Matomo lacks this feature.
| Matomo On‑Premise (free) | Matomo Cloud | Piwik PRO Business | Piwik PRO Enterprise | |
|---|---|---|---|---|
| Android – Java | ||||
| Android – Kotlin | ||||
| iOS – Swift | ||||
| iOS – Objective-C | ||||
| Flutter | ||||
| React Native | ||||
| SPA – Single Page Application | ||||
| PWA – Progressive Web Apps | ||||
| AMP – Accelerated Mobile Pages | ||||
| Data anonymization | ||||
| Content tracking | ||||
| Search engine keywords | ||||
| Rich documentation | ||||
| Ease of implementation |
Chapter 11
Search Console & Google Ads integration
To optimize your advertising campaigns and on-site SEO, you need to arm yourself with behavioral data and data from Search Console and Google Ads. Check out what Piwik PRO and Matomo have to offer in this field.

Chapters
- In a nutshell
- Differences between companies
- Differences between products
- Performance & reliability
- Reporting flexibility & customization
- Customer Data Platform
- Data visualization & comparison
- Tracking & reporting traffic sources
- Website performance reports & metrics
- Mobile & app analytics
- Search Console & Google Ads integration
- Support & SLA
- Privacy & security compliance
- Data security
- Which one should you choose?
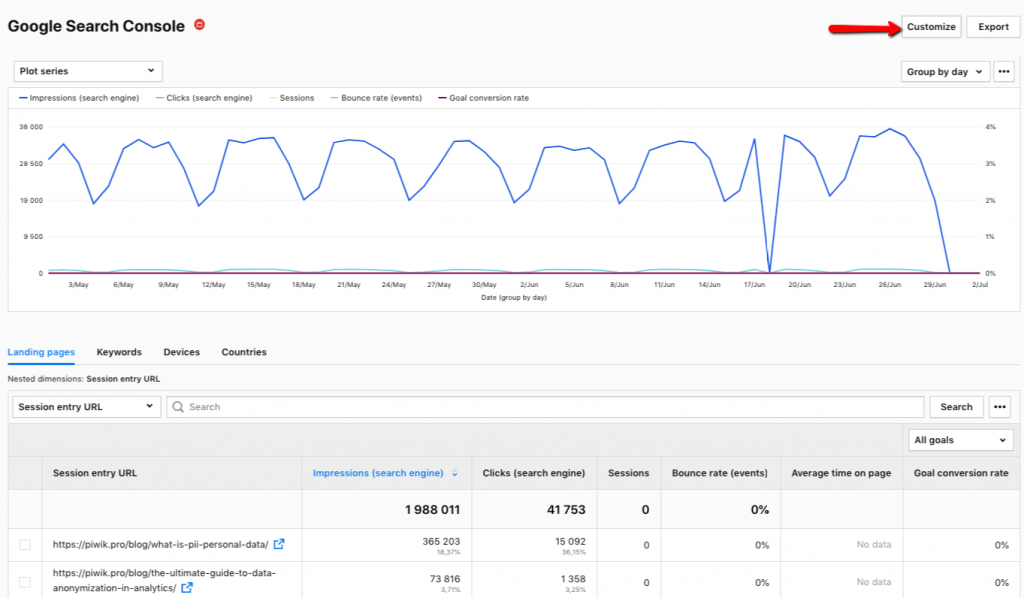
With Piwik PRO, you can fully integrate your analytics with the data from Google Search Console, namely:
- Impressions – for keywords searched on Google
- Clicks – for keywords
- CTR – ratio between impression and click for keywords
- Average position of the keyword in Google search results for a given time period
This will allow you to enhance your data collection with new data points that help you assess your performance in search results. You can apply Google Search Console metrics to your dashboards and segments in custom and default reports. Also, you can segment every data bit from GSC reports by using the wide range of dimensions available in Piwik PRO.
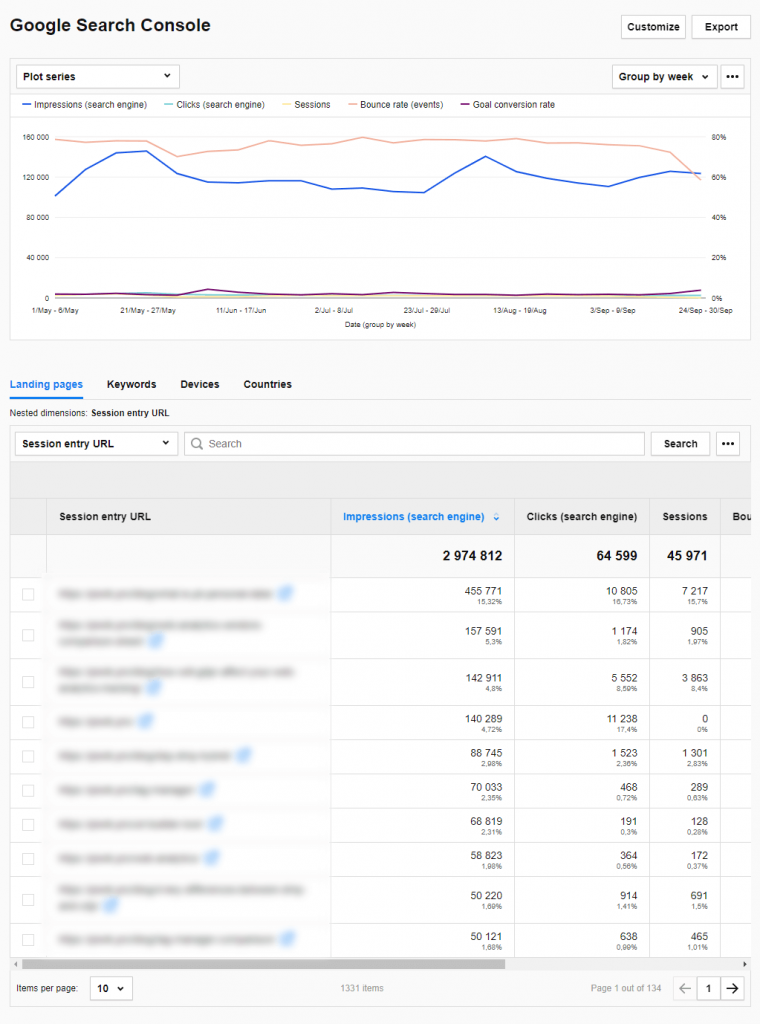
Matomo’s Google Search Console integration works quite differently. You only see a preview of GSC data displayed in the Matomo interface.
What’s more, you can’t:
- Combine GSC metrics with analytics dimensions and metrics
- Link keyword data with behavioral metrics like bounce rate or conversion rate
- Apply segments to GSC reports and GSC data
This means that you won’t use Google Search Console data in custom combinations with any other analytics dimensions and metrics.
| Matomo (On‑Premise & Cloud) | Piwik PRO (Business & Enterprise) | |
|---|---|---|
| Google Search Console Integration | ||
| Segmenting GSC data | ||
| Using GSC data in other reports | ||
| Mixing keyword data and behavioral data |
Google Ads integration
Another key integration is with Google Ads.
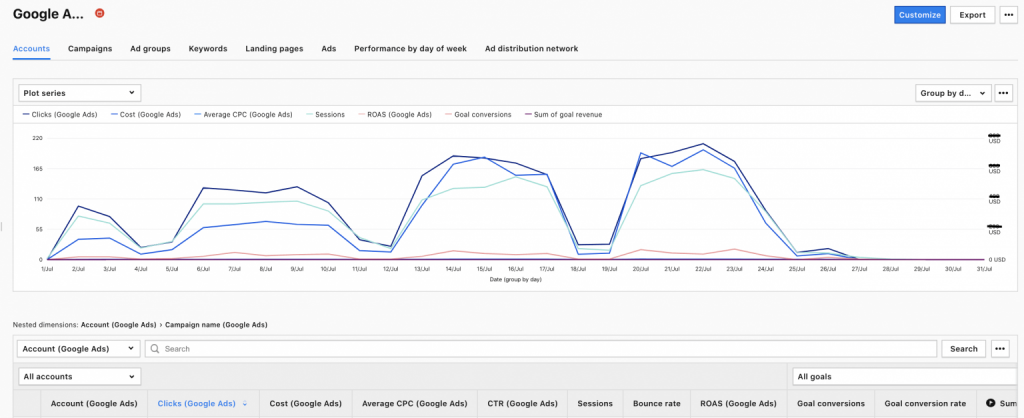
In the case of Piwik PRO, the Google Ads report encompasses the following set of metrics:
- Clicks (fetched from Google Ads)
- Cost (fetched from Google Ads)
- Average cost per click – CPC (fetched from Google Ads)
- Click-through rate – CTR (fetched from Google Ads)
- Sessions
- Bounce rate
- Return on ad spend – ROAS
- Goal conversions (for a specific goal or all goals)
- Goal conversion rate (for a specific goal or all goals)
- Sum of goal revenue (for a specific goal or all goals)
These are the default metrics, and you can add any number of additional metrics available in Piwik PRO (e.g. ads impressions) by creating a custom report. On top of that, you can combine Google Ads metrics with behavioral data or segment them using dimensions of your choice.
The report is divided into eight sub-reports that let you track:
- Google Ads accounts: Tells you about accounts connected to your website.
- Campaigns: Tells you which campaigns bring traffic to your website.
- Ads: Tells you which ads bring traffic to your website.
- Ad groups: Tells you which ad groups bring traffic to your website.
- Keywords: Tells you which keywords are used to display ads.
- Landing pages: Tells you about URLs to which visitors were sent from ads or keywords on Google Ads.
- Performance by day of week: Tells you how much traffic your ads generate each day of the week.
- Ad distribution networks: Tells you in which network your ad was displayed (i.e. search, search partners or Google Display Network).
Read more about the capabilities of Piwik PRO Google Ads integration here.
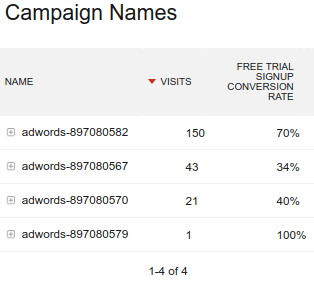
With Matomo, data related to Google Ads is available in the campaigns report. The information you’ll find there is limited to:
- Campaign name
- Number of visits
- Unique visitors
- Actions
- Actions per visit
- Average time on the website
- Bounce rate
- Conversion rates for different goals on your website
If that’s not enough for you, a paid plugin Advertising Conversion Export lets you import additional data from your Google Ad account. The information will be arranged into seven sub-reports:
- Google Ad account
- Campaigns
- Devices
- Networks
- Keywords
- Search queries
- Click performance (displayed in a report listing all clicks)
However, outside the plugin, data can be used only for the Visitor log & profile and Goal reports. You can’t freely mix and match the information from Google Ads with different metrics and dimensions or use it in custom reports.
| Matomo On‑Premise (free) | Matomo Cloud | Piwik PRO (Business& Enterprise) | |
|---|---|---|---|
| Google Ads integration | |||
| Types of Google Ads reports | 1 | 7 | 8 |
| Using Google Ads data in custom reports | |||
| Mixing Google Ads data with behavioral data |
Chapter 12
Support & SLA
Without deep knowledge of the product, you won’t be able to exploit its full potential. And without dedicated technical support, your inquiries may get stuck in a long queue of pending tickets with queries from users. Here’s what Piwik PRO and Matomo offer regarding support and customer care.

Chapters
- In a nutshell
- Differences between companies
- Differences between products
- Performance & reliability
- Reporting flexibility & customization
- Customer Data Platform
- Data visualization & comparison
- Tracking & reporting traffic sources
- Website performance reports & metrics
- Mobile & app analytics
- Search Console & Google Ads integration
- Support & SLA
- Privacy & security compliance
- Data security
- Which one should you choose?
Piwik PRO Enterprise offers the following to all clients:
A dedicated account manager – assists you in defining your business needs and translating them into actionable advice for using the platform.
Detailed documentation – provides detailed infrastructure guidelines to ensure optimal product performance.
Dedicated technical support – to give you a first point of contact in case of emergencies or web analytics performance issues.
Custom integration and development(extra service) – to integrate PPAS with every product in your data ecosystem (e.g., CRMs or BI tools) and adopt the platform to your needs through custom development.
Analytics consulting(extra service) – to advise you on what to change in your tracking and reporting bringing you closer to your business objectives.
On-demand custom training and workshops (extra service) – to let you learn the skills required to use analytics insights in your day-to-day work. Every training is unique, because we tailor them to the use cases of particular teams and stakeholders.
24/7 monitoring and incident handling – to make sure your platform is up and running and performing well.
Piwik PRO provides those services during both American and European business hours. Guaranteed response time for the top-level plan is four business hours.
The exact list of support and customer care services will depend on the chosen plan. You can learn more on our professional services page.
As for paid versions of Matomo, depending on the plan (Essential, Business, Enterprise or extra support for Matomo on-premise), you’ll get:
- Email-based support
- User guides
- Community support (a forum)
- A dedicated account manager
- An onboarding questionnaire and a meeting with a Matomo support team member
With the highest plan, the response time of Matomo’s support team is one business day.
| Matomo On‑Premise (free) | Matomo Cloud | Piwik PRO Business | Piwik PRO Enterprise | |
|---|---|---|---|---|
| Email support | ||||
| User guides | ||||
| Community forum | ||||
| Dedicated account manager | ||||
| Personalized implementation & onboarding | optional add-on | |||
| Dedicated training (on-site or remotely) | optional add-on | |||
| Analytics consulting | optional add-on | |||
| Custom development & integrations | ||||
| 24/7 monitoring and incident handling | ||||
| Support response time | avg. 1 business day | 24 hours | 8 hours | |
| Support team’s business hours | New Zealand (GMT+13) | Europe (GMT+1) and US Eastern Time (GMT-5) |
Want to learn how we can help you achieve more with your analytics data? We’re here to answer all your questions!
Chapter 13
Privacy & security compliance
Ensuring adequate protection of user data has always been a core value for both Piwik PRO and Matomo. Take a closer look at how they manage compliance with different privacy and security laws worldwide.

Chapters
- In a nutshell
- Differences between companies
- Differences between products
- Performance & reliability
- Reporting flexibility & customization
- Customer Data Platform
- Data visualization & comparison
- Tracking & reporting traffic sources
- Website performance reports & metrics
- Mobile & app analytics
- Search Console & Google Ads integration
- Support & SLA
- Privacy & security compliance
- Data security
- Which one should you choose?
GDPR
We take pride in the fact that our product has been audited and found compliant by a top global consulting firm. Our platform not only meets the privacy standards laid out in GDPR but helps organizations fulfill their obligations arising from the regulation.
One of the most important of these obligations is that every website owner should collect informed, active, unambiguous and granular consents before they start tracking personal data.
Find some more guidance on managing user consents under GDPR: A practical guide to acquiring consent in the age of GDPR
Below, we describe how these responsibilities are addressed by Matomo and Piwik PRO.
Gathering consents & data subject requests
With Matomo, you’ll have to implement the code of the privacy notice mechanism into your website, following the instructions provided by the team. In practice, you’ll need to have developer-like skills to manage the task.
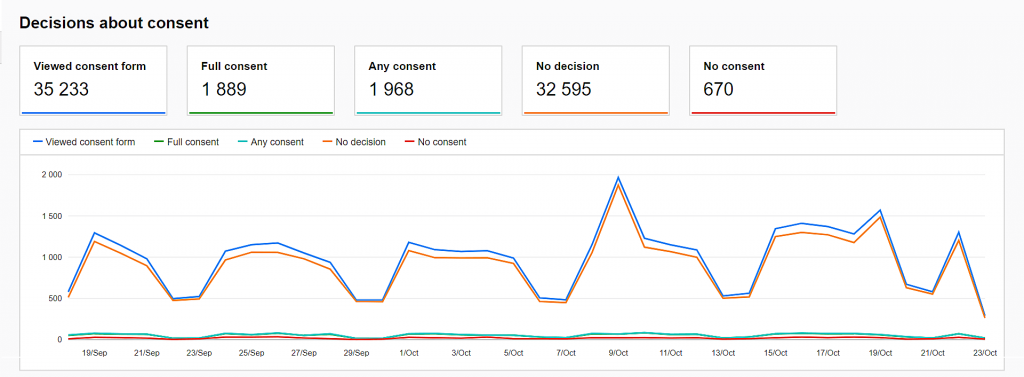
Piwik PRO lets you take advantage of a Consent Manager. It’s a dedicated tool for collecting and managing visitor consent and data subject requests.
You’ll be able to configure everything without touching a piece of code and see the most important statistics regarding user consents and data subject requests:
Want to learn more about the product? Visit this page to get to know the ins and outs of our GDPR Consent Manager.
| Matomo On‑Premise (free) | Matomo Cloud | Piwik PRO (Business & Enterprise) | |
|---|---|---|---|
| Customizable consent forms (modal & pop-up) | |||
| User-friendly consent form editor | |||
| Support for custom HTML consent form | |||
| Collecting consents for the use of third-party tools | |||
| Displaying consent requests for certain regions (e.g. EEA) | |||
| Consent reminder widget | |||
| Consent management widget | |||
| Data subject request widget | |||
| Data subject request admin panel | |||
| Data subject request history | |||
| Consent performance statistics | |||
| Zero cookie load |
HIPAA
Matomo assures HIPAA compliance only when the client keeps the data on their own infrastructure. Piwik PRO Enterprise, in turn, allows for collecting and storing data in line with the law in the public and private cloud hosting plans.
To learn more, visit our HIPAA compliance website and read Piwik PRO is officially HIPAA certified!
Data residency laws
Numerous countries, such as Germany, Australia, Canada, India, Switzerland, Russia and China, have introduced laws that order companies to keep their residents’ personal data within the country’s physical borders.
Considering Matomo, you will be able to meet these obligations if you decide to host your data on-premises. For Germany, you can also use the Matomo Cloud, because that’s where its cloud servers are located.
Piwik PRO gives you a greater variety of options. You can:
- Choose one of our cloud data centers in the Netherlands, Sweden, France, Germany, Hong Kong and the US.
- Use one of Azure cloud servers in 60+ locations around the world, or Elastx in Sweden.
| Matomo On‑Premise (free) | Matomo Cloud | Piwik PRO Business | Piwik PRO Enterprise | |
|---|---|---|---|---|
| Full control over data | ||||
| GDPR compliance | ||||
| HIPAA compliance | depends on your infrastructure | |||
| Cloud server location | Germany | EU data center | selected data center: Germany, the Netherlands, Sweden, France, Hong Kong or the US | |
| Private cloud server location | 60+ Azure regions, and Elastx in Sweden | |||
| On-premises data residency | depends on your server location |
Anonymizing data
Another way of maintaining high privacy standards is to erase personal data from your databases.
On Matomo’s website you’ll find information that its platform allows you to:
- Anonymize previously tracked raw data – like visitors/visits
- Anonymize visitor IP addresses
- Anonymize geolocation information (country, region, city)
- Pseudonymize user IDs (if you don’t want this data to land on your Matomo server, the solution is simply to not set the user ID. Then Matomo will use normal anonymized IDs)
- Data can also be anonymized before it’s even sent to Matomo
It’s worth noting that if you choose to anonymize the data after collecting it, you still need to obtain visitors’ consents and fulfill other obligations involved in dealing with personal data. This approach defeats the purpose of anonymizing the data and is incompatible with GDPR’s data protection by default principle.
But since pseudonymous data is still considered personal information, you have to collect valid consents to process it in line with GDPR and other privacy laws (e.g. LGPD). Matomo acknowledges this in a different section of its site:
User ID: when you enable this option, the User ID will be replaced by a pseudonym to avoid directly storing and displaying personally identifiable information such as an email address. In technical terms: given your User ID, Matomo will process the User ID pseudonym using a salted hash function. Note: replacing with a pseudonym is not the same as anonymisation. In GDPR terms: the User ID pseudonym still counts as personal data. The original User ID could still be identified if certain additional information is available (which only Matomo and your data processor has access to).
Piwik PRO Analytics Suite offers three methods for tracking web, intranet and app events without collecting personal data.
1) Anonymous data tracking with cookies and session data, in which:
- Browser fingerprint recognition is deactivated.
- The geolocation is based on anonymized IP addresses or is deactivated.
- A session identifier is set (session cookie).
- No personal data is tracked and stored in the database without explicit consent.
- Visitors who don’t consent appear as one-time visitors and can’t be identified across sessions.
- If the visitor consents to tracking within the session, all the collected data will be added to their profile. If you enable Piwik PRO’s CDP module, the platform creates a profile connecting additional data to mold a single customer view. This gives you the ability to retarget a specific segment of your customers.
2) Anonymous data tracking without cookies, but with session data, in which:
- Browser fingerprint recognition is deactivated.
- The geolocation is based on anonymized IP addresses or is deactivated.
- A session identifier is set.
- No personal data is tracked and stored in the database without explicit consent.
- Visitors who don’t consent appear as one-time visitors and can’t be identified across sessions.
- If the visitor consents to tracking within the session, all the collected data will be added to their profile. If you enable Piwik PRO’s CDP module, the platform creates a profile connecting additional data to mold a Single Customer View. This gives you the ability to retarget a specific segment of your customers.
3) Anonymous data tracking without cookies or session data, in which:
- Browser fingerprint recognition is deactivated
- The geolocation is based on anonymized IP addresses or is deactivated
- Session identifier and visitor recognition are deactivated
- No visitor data is saved and every event is recorded separately. Essentially, your instance doesn’t record sessions
All are what we consider to be part of a privacy-friendly approach to analytics. To learn more about their advantages and disadvantages, read this complete guide to the most popular tracking methods used in analytics software: 6 ways analytics software collects data online – plus a comparison of 5 popular platforms.
| Matomo On‑Premise (free) | Matomo Cloud | Piwik PRO Business | Piwik PRO Enterprise | |
|---|---|---|---|---|
| Anonymization techniques | ||||
| Linking personal & anonymous data about visitors who provide consent later in a session |
Chapter 14
Data security
A piece of software with high security standards allows you to protect your data against breaches and adapt to the most stringent regulations – sectoral, internal or international. In this section, you will learn what approach Piwik PRO and Matomo have to data security.

Chapters
- In a nutshell
- Differences between companies
- Differences between products
- Performance & reliability
- Reporting flexibility & customization
- Customer Data Platform
- Data visualization & comparison
- Tracking & reporting traffic sources
- Website performance reports & metrics
- Mobile & app analytics
- Search Console & Google Ads integration
- Support & SLA
- Privacy & security compliance
- Data security
- Which one should you choose?
In Piwik PRO, we make sure that our commitment to data security is demonstrated by our partnerships and by external audits of our company and product.
Below we describe the most important of them.
Secure infrastructure
You can deploy Piwik PRO on your own infrastructure, in a private cloud, at a third-party data center or on our secure servers. As a security-conscious provider, we exclusively partner with select Microsoft Azure data centers. We can offer our customers an infrastructure that is:
- ISO 27001 certified
- SOC 2 certified
- GDPR-compliant
- Fully redundant
- Ensures 99% SLA
Company ISO 27001 certification
Another expression of our approach to data security is ISO 27001 certification. It confirms that Piwik PRO, as a company dedicated to data protection, acts in line with the strictest data safety policies. The scope of the safeguards covers all information processed in Piwik PRO, in every form and in every place where we operate.
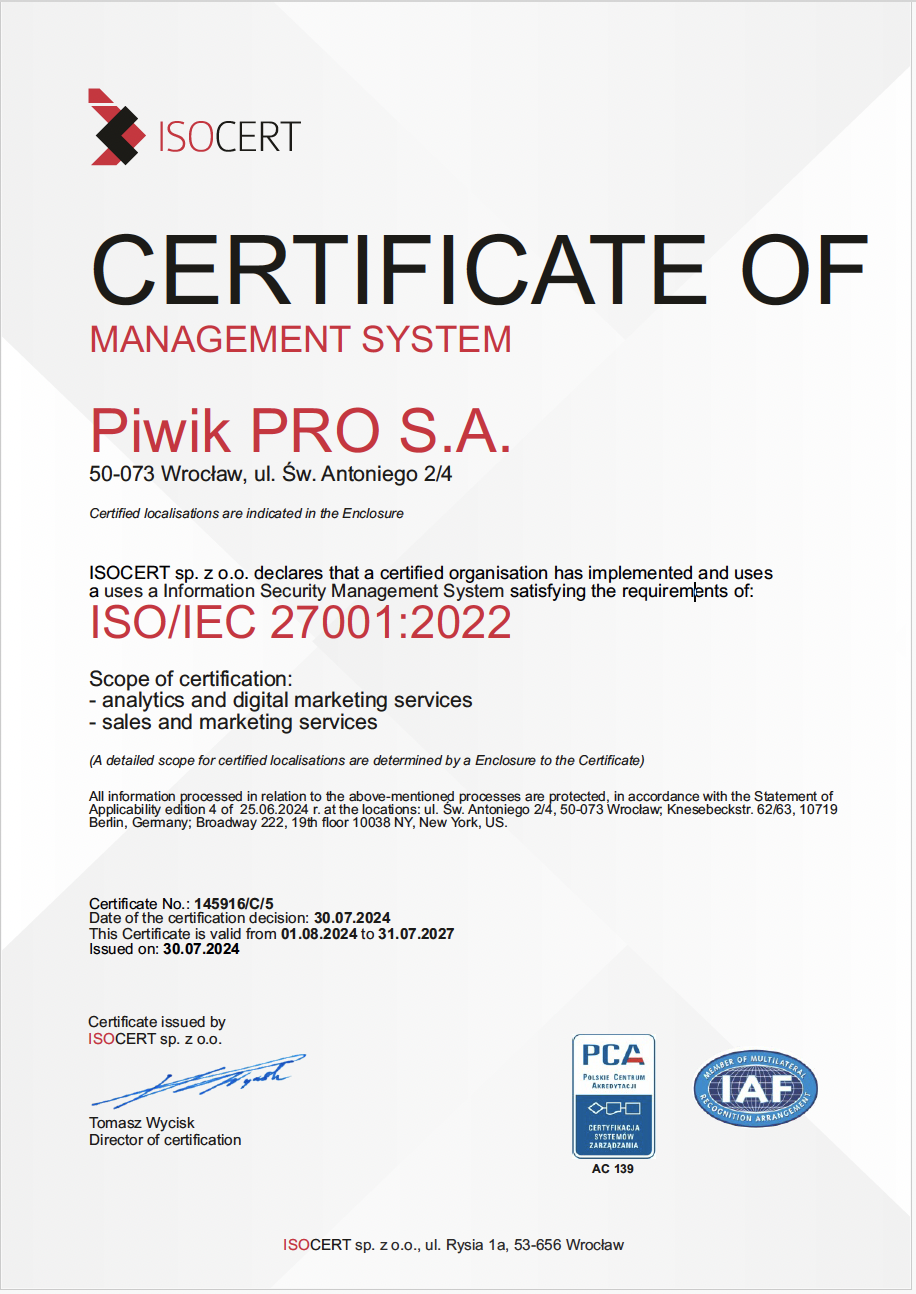

External security audit
As for the safety of our product, Piwik PRO Analytics Suite has successfully passed an audit from LogicalTrust, an experienced and impartial auditor that specializes in IT security. The audit aimed to uncover any potential vulnerabilities and deficiencies of our platform, with the focus on a third-party attempt to break the system’s security.
Thanks to the certifications and partnerships we’ve detailed above, institutions that handle sensitive information, such as banks or healthcare organizations, no longer need to conduct their own compliance assessment when buying our products.
With Matomo, companies from these sectors will still have to carry out their own audits to assess whether the level of data security provided by the platform and company is sufficient in their case.
Data security features
Let’s not forget about dedicated data security features. SAML integration and password policy are paid plugins in Matomo On-Premise and a part of the highest pricing plan in the case of Matomo Cloud. Piwik PRO provides both functionalities out of the box in the Enterprise plan.
While both products support user management, Piwik PRO allows you to also grant permissions and roles to each module of the platform at group level. This is especially useful for those with many analytics users across different teams, subdivisions or locations.
| Matomo On‑Premise (free) | Matomo Cloud | Piwik PRO Business | Piwik PRO Enterprise | |
|---|---|---|---|---|
| Full server redundancy | depends on your infrastructure | |||
| ISO 27001 certified datacenters | depends on your infrastructure | |||
| SOC 2 certified datacenters | depends on your infrastructure | |||
| Company’s security certificates | none | none | ISO 27001 | ISO 27001 |
| External security audits | last in 2014 | last in 2014 | yearly | yearly |
| SAML integration | paid plugin | |||
| User management | ||||
| User group management |
Chapter 15
Piwik PRO vs. Matomo (Piwik): Which one should you choose?

Chapters
- In a nutshell
- Differences between companies
- Differences between products
- Performance & reliability
- Reporting flexibility & customization
- Customer Data Platform
- Data visualization & comparison
- Tracking & reporting traffic sources
- Website performance reports & metrics
- Mobile & app analytics
- Search Console & Google Ads integration
- Support & SLA
- Privacy & security compliance
- Data security
- Which one should you choose?
The differences between the products offered by Piwik PRO and Matomo are significant. The most important of them are:
- The number of modules and use cases supported by each product
- The scalability of the platforms and speed at which they generate reports for medium- and high-traffic websites
- The number of options for visualizing, manipulating and comparing data
- The availability of SLAs, onboarding and maintenance
- The approach to data security and privacy, including GDPR requirements
We believe that Matomo will be a great fit for small analytics projects at companies with a fairly high level of analytical and coding knowledge.
Piwik PRO Analytics Suite, due to its advanced functionalities and efficiency, is better suited for those who want more technical support for projects of any size and for those that demand higher performance and better stability.
If you still feel like you need some more answers or simply want to get to know our platform better – contact us. Our team will gladly put together a personalized product demo for you.
This comparison is based on the publicly available information gathered in November 2022.
If you need more answers or want to get to know our platform better – feel free to contact us!
Our team will gladly dispel any of your doubts and showcase a personalized product demo