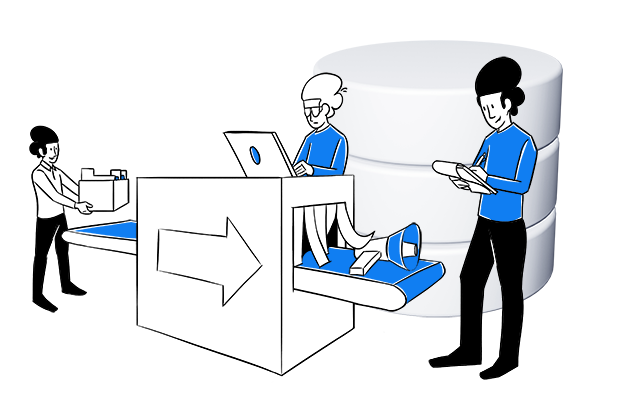
Real-time reporting in analytics refers to generating and delivering reports on data as it is collected or updated. It enables businesses and organizations to instantly monitor their operations, performance, and key metrics, allowing for quick decision-making and timely actions.
Typically, real-time reporting involves:
- Continuous data collection: Data is gathered from various sources such as websites, mobile apps, data warehouses, or other systems.
- Immediate data processing: Once data is collected, it is processed instantly to derive insights and generate reports without delay.
- Instantaneous visualization: The processed data is then visualized in real-time through dashboards, graphs, charts, or other visual representations, providing stakeholders with up-to-date information.
- Alerting mechanisms: Real-time reporting tools or analytics platforms offering this feature often include alerting mechanisms that notify users of significant events or anomalies as they occur, allowing for proactive responses.
Real-time reporting is particularly beneficial in industries where timely decision-making is critical, such as publishers, ecommerce, event-related businesses, healthcare, and finances. It helps organizations stay responsive to changing conditions, identify emerging trends, and seize opportunities as they arise.
The use cases of real-time reporting include:
- Content analysis: Analyze content in real-time to keep visitors on the page for as long as possible, for example, by finding the best headline in seconds.
- Live traffic monitoring: When streaming an event in real-time and looking to launch ads during the stream, it’s important to monitor live traffic to understand the number of viewers. This data can then be used to make informed decisions – for example, to adjust infrastructure while opening sales of popular events.
- Campaign monitoring: Observe the target audience’s reactions to a campaign that attracts the majority of visitors in a short period after its launch. For example, you can study the number of visitors from a certain region, when they are most active, and which ads, emails, and content they prefer.
- Ecommerce: You can monitor in real-time what products are being sold the most or what products are being added to a cart. Thanks to these insights, you may instantly react to improve sales and use various personalization strategies. You can also introduce dynamic pricing, raising prices on the high-demand products and lowering them for those not selling well.
- Improving UX: Use real-time reporting to optimize UX – user interactions, click-through rates, and quick pop-up surveys.
- Tracking product launch metrics: This helps you measure your progress toward achieving your predefined goals and objectives.
- Website implementation: Use real-time reports to monitor different website aspects. For example, ensure everything works correctly after an update or check whether campaigns are appropriately tagged in reports instead of a tracker debugger.
Read more: Digital marketing analytics: The beginner’s guide to data-driven marketing success