
Digital marketing analytics is the practice of gathering, analyzing, and interpreting data from digital channels like websites, social media, email campaigns, and paid advertising to make informed marketing decisions and improve performance.
By tracking key metrics across these channels, marketers can understand customer behavior, optimize campaigns in real-time, and demonstrate clear ROI.
As markets become increasingly competitive and consumer behaviors more complex, data-driven marketing strategies are no longer optional – they’re essential.
According to Forrester Consulting’s 2024 research, incorporating first-party customer behavioral data into marketing strategies positively impacts customer acquisition costs by 83%, customer satisfaction by 78%, and ROI by 72%.
In this guide, you’ll learn how to measure your results effectively and use marketing data analytics to enhance your performance across all digital channels.
Key takeaways
- Digital marketing analytics helps you measure performance across all digital channels including websites, social media, email, and paid campaigns
- Focus on actionable metrics (conversion rates, organic traffic quality, funnel drop-offs) rather than vanity metrics (total pageviews without context)
- Essential reports include content performance, SEO data from Google Search Console, paid campaign ROI, and conversion funnels
- Current trends prioritize first-party data collection, privacy compliance, data integration, and real-time data activation
- Choose metrics using the S.M.A.R.T. framework and ensure they align with specific business goals
- Privacy-first analytics is mandatory with 79% of the global population now covered by data protection laws
Table of contents
- Key takeaways
- What is digital marketing analytics?
- Why is digital marketing analytics important?
- Common sources of digital marketing analytics data
- What metrics should you track in digital marketing analytics?
- Actionable metrics vs. vanity metrics
- What are the most important digital marketing analytics reports?
- 1. Optimize your content with the content performance report
- 2. Improve SEO performance with Google Search Console integration
- 3. Boost the ROI of your paid campaigns with Google Ads integration
- 4. Optimize conversion paths on your website with funnel reports
- 5. Evaluate newsletter performance with UTM tags
- Customize reports to your needs
- What are the latest trends in digital marketing analytics?
- Digital marketing analytics: Key takeaways
- FAQ: Common questions about digital marketing analytics
- What’s the difference between web analytics and digital marketing analytics?
- How often should I check my digital marketing analytics?
- What tools do I need for digital marketing analytics?
- Can small businesses benefit from digital marketing analytics?
- What’s the most important metric in digital marketing analytics?
- How do privacy regulations affect digital marketing analytics?
- How can I prove marketing ROI with digital marketing analytics?
What is digital marketing analytics?
Digital marketing analytics is the practice of gathering, analyzing, and interpreting data to make informed decisions and improve marketing performance across all your channels.
These channels may include:
- Social media platforms (Facebook, LinkedIn, Instagram, Twitter)
- Websites and landing pages
- Paid advertising campaigns (Google Ads, Facebook Ads, display networks)
- Email marketing and newsletters
- Search engines and SEO performance
- Mobile applications
- Content marketing initiatives
Digital marketing analytics is vital in helping you improve your marketing results and achieve your business goals.
Why is digital marketing analytics important?
As markets become increasingly competitive and consumer behaviors more complex, data-driven marketing strategies become a must. Here’s why digital marketing analytics is crucial:
Make data-driven decisions, not assumptions
Without analytics, you’re essentially guessing what works. With proper measurement, you know exactly which campaigns drive results and which waste budget.
Optimize marketing ROI
By identifying which channels and campaigns generate the best return, you can allocate resources more efficiently. This is critical as advertising costs continue to rise and competition intensifies.
Understand customer behavior
Analytics reveals patterns in how customers interact with your brand across touchpoints, helping you create marketing campaigns that resonate with your audience.
“Advertising is becoming more expensive and ineffective. Why? Because there is more and more advertising. This is precisely why analytics is becoming increasingly indispensable in marketing. Marketing must once again set the tone through target group-oriented communication and advertising that focuses on the customer.”
Philipp Loringhoven, Freelancer for Marketing Analytics and Strategy
Prove marketing value
With proper analytics, you can demonstrate clear ROI to stakeholders, showing exactly how marketing efforts contribute to business growth.
Personalize customer experiences
By analyzing data from various sources, you can identify patterns and trends in customer activities. This information is extremely valuable for creating marketing campaigns that target your audience effectively.
Research shows that 80% of customers are more likely to purchase from a brand that provides personalized experiences.
Common sources of digital marketing analytics data
Digital marketing analytics data comes from multiple sources across your marketing stack:
| Data source | What it provides | Key platforms |
|---|---|---|
| Website analytics | Visitor behavior, page performance, conversion paths | Piwik PRO Analytics Suite, Google Analytics |
| Search console data | Keyword rankings, impressions, click-through rates, search queries | Google Search Console |
| Advertising platforms | Campaign performance, clicks, impressions, CPC, ROAS | Google Ads, Facebook Ads, LinkedIn Ads |
| Email marketing | Open rates, click rates, conversion tracking | Mailchimp, HubSpot, via UTM parameters |
| Social media analytics | Engagement rates, reach, follower growth, social conversions | Platform-specific insights |
| CRM and sales data | Lead quality, customer lifetime value, sales cycle length | Salesforce, HubSpot |
| Customer data platforms | Unified customer profiles, cross-channel behavior | Piwik PRO Data Activation |
When thinking about marketing analytics, you’ll work with widely-known metrics that help gather basic information about visitors, such as:
- Sessions
- Visitors (unique and returning)
- Page views
- Events per session
- Percentage of returning visitors
- Conversions
- Conversion rate
These metrics give you a basic overview of your audience and show how they interact with your website – a great starting point for future marketing decisions.
However, that’s barely the tip of the analytics iceberg. In the next sections, you’ll learn practical tips that let you dig even deeper into your website performance, campaigns, newsletters, and more.
What metrics should you track in digital marketing analytics?
Key performance indicators (KPIs) help you evaluate if you’re getting closer to your goal. As a marketer, you should rely on accurate metrics, ask precise questions, and provide answers to those questions based on reliable data.
But first, you need to know how to arrive at the right KPIs for your organization. Every company has different goals and achieves them in different ways. That’s why you can’t make actionable decisions based on one-size-fits-all KPIs.
Essential metric categories for digital marketing
| Metric type | Examples | Why it matters | Action you can take |
|---|---|---|---|
| Traffic quality | Organic traffic by content, traffic source conversion rates | Shows which channels bring engaged visitors | Focus budget on high-converting channels |
| Conversion metrics | Conversion rate, funnel drop-offs, goal completions | Reveals where you’re losing potential customers | Optimize pages with highest abandonment |
| Campaign performance | ROAS, CPC, CTR, cost per acquisition | Measures advertising effectiveness | Pause underperforming ads, scale winners |
| Content engagement | Time on page, content interaction rate, scroll depth | Shows what content resonates | Create more of what works |
| SEO performance | Keyword rankings, click-through rate, landing page performance | Indicates search visibility | Optimize for high-impression, low-CTR keywords |
Defining your strategy and KPIs
This makes defining your strategy and key performance indicators a priority. To start, you need to answer the following:
1. What’s my company’s goal? Focus on one primary goal. As a rule of thumb, this will be profit-related.
2. What are the goals for each of my marketing activities and channels?
Think of the various marketing activities and channels you use, and determine goals for each:
- Website goals: Typically include generating leads, account sign-ups, closing online transactions, increasing content engagement
- Paid campaign goals: Usually include increasing brand awareness, generating qualified leads, or driving direct sales
- Newsletter goals: Often focus on nurturing leads, enhancing customer engagement, or promoting specific products or events
- Social media goals: Building community, driving traffic, increasing brand awareness, or generating engagement
3. What data will show me that these goals are being met?
Decide which data will be assigned to each goal. This might not be clear yet, so you can refine this as you go.
Use the S.M.A.R.T. framework
In the next step, use the S.M.A.R.T. principle to set effective goals:
| S.M.A.R.T. Criteria | Question to Ask | Example |
|---|---|---|
| Specific | What exactly do I want to achieve? | Increase newsletter sign-ups from blog visitors |
| Measurable | How will I know the goal is achieved? | Track form submissions via goal tracking |
| Achievable | Is this goal realistic? | Current rate is 2%, targeting 4% is realistic within resources |
| Relevant | Does this support business objectives? | More subscribers = larger nurture audience = more sales opportunities |
| Time-bound | When should this be achieved? | Achieve 4% conversion rate within next quarter |
By setting these goals, you narrow down the data range you will work with. This helps you choose the right KPIs for your analysis.
Actionable metrics vs. vanity metrics
To make informed decisions, you must differentiate between actionable and vanity metrics. The success of your analytics strategy lies in focusing on metrics that truly matter to your business and provide actionable insights rather than just pretty numbers.
Actionable metrics: Match your measurements to the customer journey
Actionable metrics provide clear insights you can act upon – but which metrics matter depends on your business model and where someone is in their journey with your brand.
Context matters: B2C vs B2B measurement
What counts as “actionable” varies dramatically by business type. An ecommerce store processing hundreds of daily transactions can spot meaningful patterns within days. A B2B SaaS company with 6-month sales cycles needs months of data before trends become clear.
This affects everything from which metrics you prioritize to how quickly you can act on them. Ecommerce brands might optimize based on yesterday’s cart abandonment rate.
B2B companies need to track engagement over weeks or months before a lead becomes sales-qualified.
Awareness stage: Focus on engagement, not conversions
At the top of the funnel, your blog posts and social media content are introducing people to your brand. Expecting direct conversions here sets you up for disappointment. Instead, measure:
- Organic traffic and time on page
- Engagement signals (scroll depth, clicks to other pages)
- Social shares and comments
For example, if 90% of your organic traffic comes from a single blog post, that’s a red flag for your content strategy. Diversifying your content reduces risk and creates multiple pathways for discovery.
Consideration and conversion stages: Measure what matters
As people move down the funnel, your metrics should shift. Landing pages from paid campaigns exist for one reason: conversions. Here, tracking conversion rate and cost per acquisition makes perfect sense.
But context is everything. A 50% conversion rate sounds impressive – until you realize it’s based on two visitors. The same rate from 100,000 visitors tells a very different story about campaign effectiveness.
Use the right time ranges for meaningful insights
The timeframe you analyze matters just as much as the metrics you choose – and your business model determines what “meaningful” looks like.
For ecommerce and high-volume businesses:
- Daily/weekly analysis catches issues fast and capitalizes on trends
- You can run A/B tests and see results within days
- Seasonal patterns emerge clearly within a single quarter
For B2B SaaS and long sales cycles:
- Monthly snapshots help track lead progression
- Quarterly reviews reveal which content nurtures leads effectively
- Annual comparisons show true growth beyond normal fluctuation
A 5% conversion rate from 10 visits over a day means nothing. The same rate from 100,000 visits over a quarter reveals patterns you can trust. But if you’re in B2B with 50 monthly website visitors and two demo requests, those numbers might actually be right on target.
The key is matching your measurement timeframe to your reality. Don’t force daily optimizations when your sales cycle demands patience.
What are vanity metrics?
Vanity metrics might seem impressive at first glance, but they don’t offer real, actionable insights. They can be misleading and present an overly optimistic view of the website’s performance without the necessary context.
Examples of vanity metrics include:
Overall website traffic and pageviews
Without the context of conversion data or segmentation (like channel, location, or device), these metrics provide you with little to no actionable insight.
They can give you a false, inflated view of your website’s performance without indicating any real success in engaging or converting visitors.
Paid media traffic
Traffic generated from paid sources is often deceptive. While it can boost your numbers, it doesn’t necessarily translate into value for your business, especially if it doesn’t result in conversions or higher user engagement.
Poorly defined conversions
Knowing the number of conversions without understanding the conversion type (micro vs. macro) or the broader context can be misleading.
For example, when a visitor clicks on a ‘Submit form’ button but doesn’t send the form because of an error, you shouldn’t count the click as a conversion. After all, the form was ultimately not sent.
Data without context
When you analyze metrics in isolation, without considering the broader context, it can lead you to misguided conclusions.
For example, a low bounce rate might seem positive at first glance. But if you don’t compare it with data like the conversion rate, it provides little to no insights. That is to say, it may turn out that the visitors who don’t bounce also don’t convert later on.
Best practices for choosing the right actionable metrics
When choosing actionable metrics, consider the following best practices:
Relevance: Ensure the metric aligns with your marketing and business goals and helps you make more informed decisions.
Context: Always analyze metrics within the broader context of your business, like changing industry trends or customer behavior.
Consistency: Use consistent methods and time frames to ensure reliable comparisons of the measured metrics.
Actionability: Choose metrics that offer insights leading to specific, actionable steps, not just numbers to admire.
If you want to learn more about setting and analyzing your goals, visit our help center article on using goals.
Actionable metrics vs. vanity metrics – quick summary
| Actionable metrics | Vanity metrics | |
|---|---|---|
| Definition | Provide clear insights you can act upon, directly tied to business goals | Look impressive but don’t offer real, actionable insights |
| What they tell you | Why something is happening and what to do about it | That something is happening, without context or meaning |
| Examples | • Organic traffic with content performance breakdown • Conversions with rate, volume, and timeframe • Engagement signals by funnel stage • Cost per acquisition | • Overall pageviews without segmentation • Paid traffic without conversion data • Button clicks counted as conversions • Bounce rate without conversion context |
| Context | Analyzed with segmentation, customer journey stage, business model, and appropriate timeframes | Presented in isolation without broader business context |
| Business value | Leads to specific actions and strategy improvements | Presents optimistic view without indicating real success |
| Example | 50% conversion rate from 100,000 visitors over a quarter reveals campaign effectiveness | 50% conversion rate from 2 visitors means nothing |
What are the most important digital marketing analytics reports?
Now let’s dive into the essential reports that help you gain valuable insights and boost your marketing efforts.
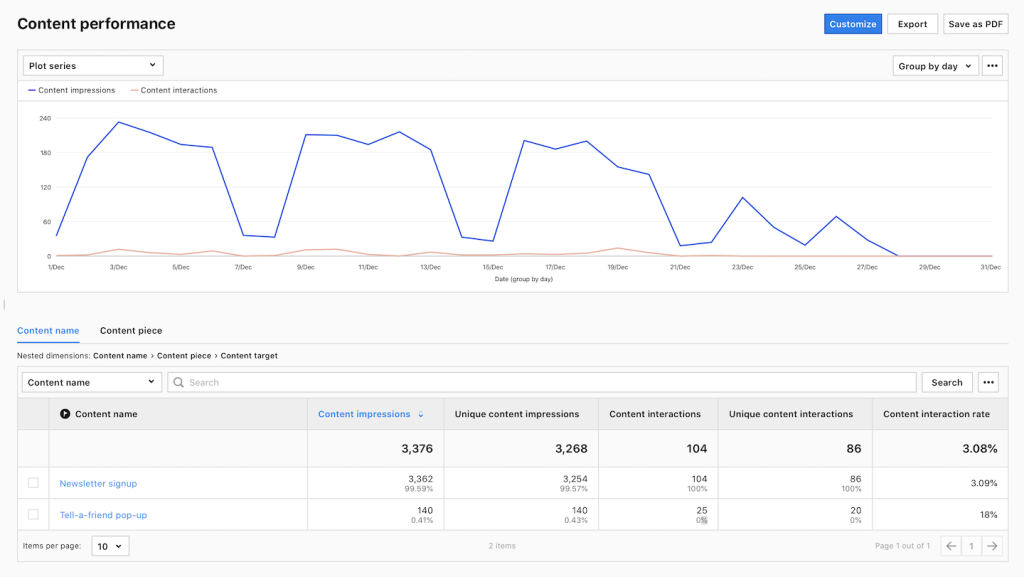
1. Optimize your content with the content performance report
Measuring content performance allows you to pinpoint pieces of content that capture your audience’s attention. It helps you understand their interests and identify areas for improvement.
A data-driven content optimization strategy may lead to higher user engagement, increased traffic, and better conversion rates. This can only be achieved by consistently analyzing and adjusting your content strategy based on data.
That’s why a reliable content performance report is a true game-changer. It shows how many times people viewed and interacted with different parts of your site, like banners, popups and contextual ads, by providing the following metrics:
- Content impressions
- Unique content impressions
- Content interactions
- Unique content interactions
- Content interaction rate
By analyzing this data, you can identify the content elements that engage your visitors and those that don’t. This allows you to improve underperforming elements and replicate the successful ones elsewhere on your website.
To learn more about measuring content performance, visit our help center article.
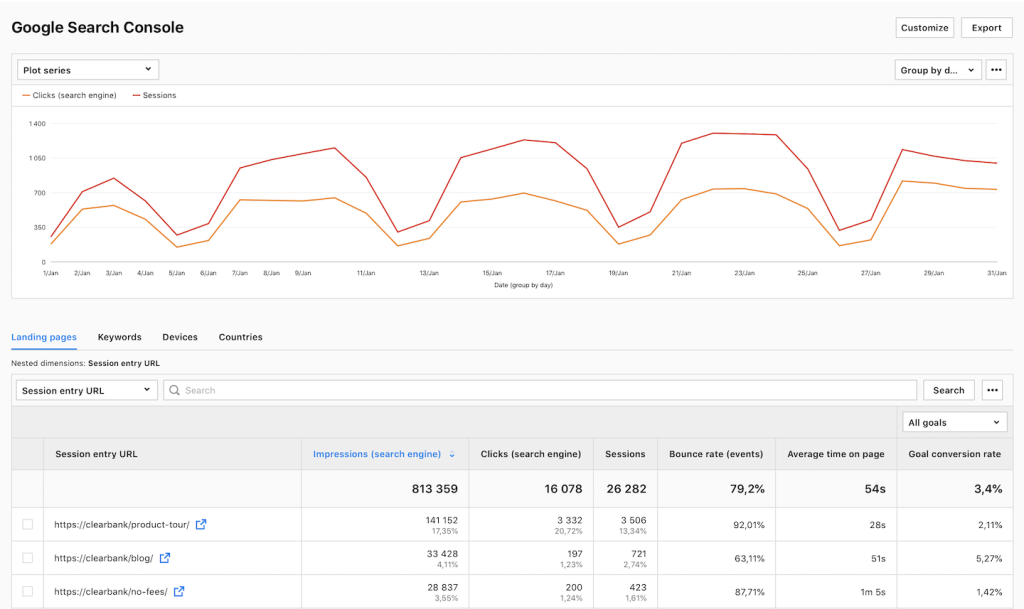
2. Improve SEO performance with Google Search Console integration
Integrating your analytics platform with Google Search Console is crucial for detailed search analysis and refining your SEO tactics. Doing so will allow you to see specific searches people run on Google before visiting your site and the web pages they landed on.
The Google Search Console report provides information about your site’s performance in Google through the lens of four key sections:
Landing pages: Impressions, Clicks, Sessions, Bounce rate, Average time on page, Goal conversion rate.
Keywords: Impressions, Clicks, CTR, Average position.
Devices: Impressions, Clicks, Sessions, Bounce rate, Goal conversions, Goal CTR, Sum of goal revenue.
Countries: Impressions, Clicks, Average position.
Whether it’s tweaking landing page content to increase user engagement or refining keyword strategies for better search visibility, this report is a cornerstone for data-driven SEO strategies.
Monitoring device metrics will help you ensure optimal user experience across all platforms, which is crucial for maintaining low bounce rates and high conversions. Additionally, gaining insights into specific geolocations can help you tailor your SEO tactics to enhance visibility in the key markets for your business.
To learn more about improving SEO performance, visit our help center article.
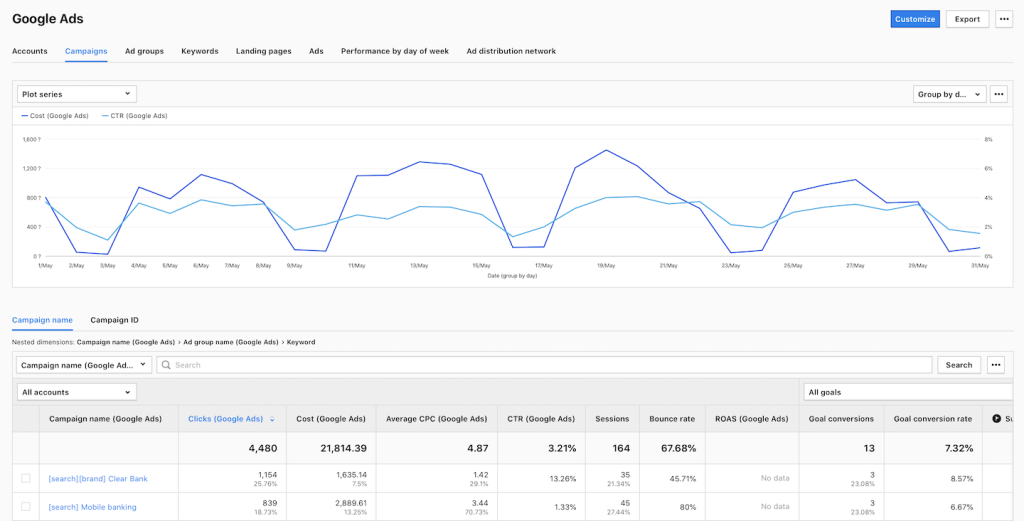
3. Boost the ROI of your paid campaigns with Google Ads integration
Linking your Google Ads account with your analytics platform lets you see which campaigns are doing a good job at driving traffic to your website and converting visitors into customers. This way, you can refine your campaigns, allocate more resources to high-performing ads and pause those that are not generating results.
Analyzing the Google Ads data provides you with in-depth insights into how users interact with your ads, helping you optimize your ad copy and target keywords better. This, in turn, leads to more effective ad placements, improved click-through rates, and increased conversions.
The Google Ads report consists of 8 subreports:
- Accounts connected to your analytics platform
- Campaign performance of the campaigns set up in Google Ads that bring traffic to your site
- Ad group performance of the ad groups set up in Google Ads
- Keyword performance of the keywords set in Google Ads
- Landing pages with the URLs where visitors were directed from ads
- Ad performance of the ads set up in Google Ads
- Performance by day of week with traffic generated by your ads
- Ad distribution network with data about where your ad was displayed
Key metrics include:
Clicks – the number of clicks on your ad.
Average cost per click (CPC) – the amount you paid for your ad divided by the total number of clicks.
Average CPC = (Cost / Clicks) * 100%
Click-through rate (CTR) – measures how often people click on your ad in Google Ads after it’s shown to them.
CTR = (Clicks / Impressions) * 100%
Return on ad spend (ROAS) – shows whether your Google Ads ad spend has resulted in conversion revenue.
ROAS = (Goal Revenue + Ecommerce Revenue) / Cost (Google Ads)) * 100%
Goal conversions – the number of goals completed in a session by users who reached your page via your Google Ad.
To learn more about tracking your paid ad performance with Piwik PRO, visit our help center article.
4. Optimize conversion paths on your website with funnel reports
Funnel reports can help you identify bottlenecks that hinder user experience, streamline conversion paths, and reveal other areas for improvement.
Identifying and minimizing the friction in conversion paths is crucial for a better user experience. The funnel reports allow you to analyze each step of the customer journey on a website and gain a clear understanding of your audience’s interactions.
To generate a funnel report, you should determine the typical steps (visited pages or specific interactions) that visitors follow to achieve a goal.
After identifying these steps, you can analyze how many visitors successfully completed each stage and pinpoint where they are most likely to drop off.
For example, if you want to measure how many visits that started on a home page reached the signup page, you could create a funnel consisting of the following steps:
Home page → Product page → Click a signup button → Signup page
The report will then generate an overview of the whole path divided into individual steps with the drop-off percentage:
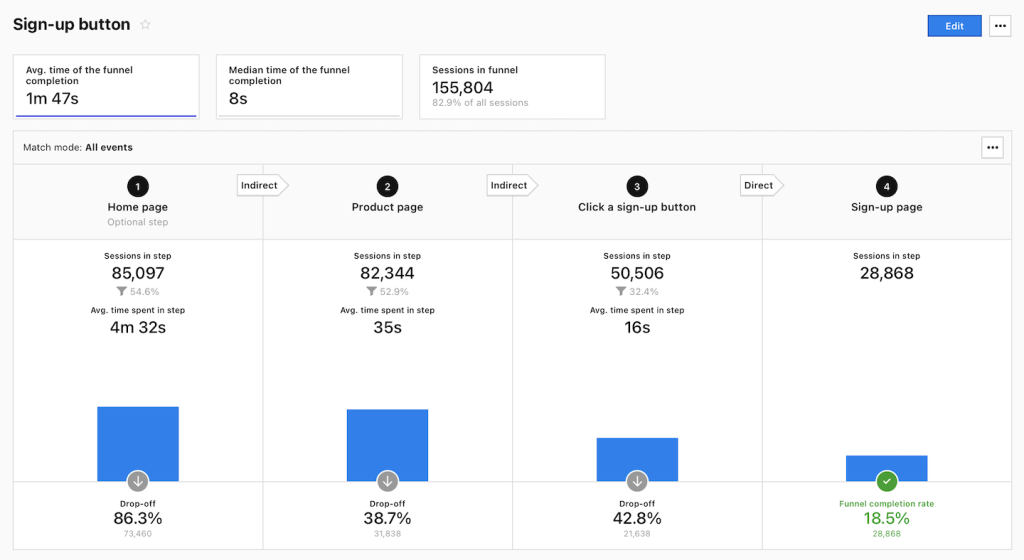
To learn more about optimizing conversion paths, visit our help center article.
5. Evaluate newsletter performance with UTM tags
Newsletters are essential to many digital marketing strategies as they directly engage your target audience. However, you must track how much traffic and conversions they drive to determine their effectiveness.
This is where UTM parameters come into play. By adding them to your newsletter links, you can gain valuable data insights on how recipients interact with your content and what actions they take as a result.
UTM parameters are added to the end of a URL. They help marketers track the performance of various online campaigns across traffic sources and publishing media, including emails.
In a newsletter scenario, each link included in the newsletter (such as blog post link or CTA) can be equipped with the same set of parameters, like in this example:
https://www.example.com?utm_source=newsletter&utm_medium=email&utm_campaign=winter_sale&utm_term=marketing_analytics&utm_content=cta_1
A standard UTM-tagged URL comprises the following five parameters:
| Parameter | Description | Newsletter Example |
|---|---|---|
| Source (utm_source) | Identifies the traffic source | newsletter |
| Medium (utm_medium) | Defines the medium where the link was used | |
| Campaign (utm_campaign) | Specifies the campaign or promotion name | winter_sale |
| Term (utm_term) | Used to segment different newsletter topics or subjects | marketing_analytics |
| Content (utm_content) | Differentiates similar content for A/B testing CTAs | cta_1 |
Note: When tagging a link, it is good to include at least three parameters: source, medium, and campaign.
Integrating UTM tagging strategy lets you track how recipients engage with your newsletters. This data can be invaluable for refining your content strategy, optimizing your call-to-actions, and improving overall user engagement.
Doing so, you can determine the effectiveness of one newsletter against another or compare its performance to other marketing channels. This gives you an idea of which newsletter topics resonate most with your target audience and how to plan future campaigns accordingly.
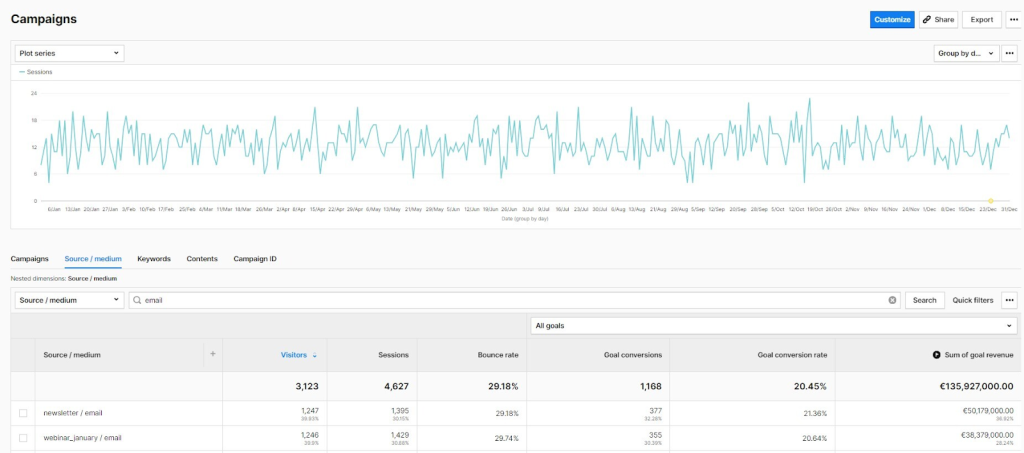
By understanding what works and what doesn’t, you can tailor your newsletters’ content, design, and CTAs to better align with your audience’s preferences and behaviors. This, in turn, will help you to use your marketing budget more effectively.
Customize reports to your needs
This is just a portion of what you can do with reports in the Piwik PRO Analytics Suite. With customizable dashboards, reports and numerous integrations, your analytics options are practically limitless.
What are the latest trends in digital marketing analytics?
It is important to stay updated on the latest digital marketing trends, as it helps to keep your mind fresh and open to new ideas.
This way, you will be better prepared for any changes that may occur, such as new privacy laws affecting your business or the deprecation of third-party cookies in popular browsers.
However, not all marketing trends are equally valuable, and they should never replace a solid marketing strategy and proven tactics.
Hence, you should prioritize the trends that are worth your time and effort. We’ll describe some of them below.
1. Privacy compliance in marketing data analytics
With the growing number of strict privacy laws around the globe, data privacy has become an integral part of marketing analytics. This necessary change gave customers more control over their data, making the collection of their data dependent on their explicit consent.
Privacy-focused strategies:
As the example of anonymous tracking shows, it is still possible to gain valuable data insights while respecting users’ privacy. One of the keys to compliant data collection is the integration of analytics and consent manager modules.
Another way of respecting users’ privacy is collecting and analyzing data that comes directly from them, known as first-party data.
This is because third-party tracking raises privacy concerns and has become increasingly difficult due to the privacy settings on browsers and the popularity of ad blockers.
Learn more about first-party data benefits:
What is first-party data and how does it benefit your marketing
Moreover, having your web analytics synced with a consent management platform, like Cookie Information, will further increase the privacy compliance of your data collection.
If you want to learn how to ensure privacy compliance in your marketing analytics, check out our masterclass webinar on privacy and marketing.
2. Data integration in marketing data analytics
Data integration is a process of combining customer data from different sources and systems to create a unified view of customer behavior and preferences, also called a single customer view.
By integrating data, marketers eliminate data silos and gain a comprehensive understanding of their customers. This helps develop effective marketing strategies to improve customer engagement and retention.
“It is important to recognize patterns and use them for targeted communication. This is how customer-oriented companies operate. When they combine data from sales, support, or shipping to display messages at the right time in the right format on the right channel, consumers feel that they are being taken seriously. Sometimes this is email, sometimes letter, or sometimes voice messages. And as marketers, we want customers to feel better about our service because that ensures a better repurchase rate.”
Philipp Loringhoven, Freelancer for Marketing Analytics and Strategy
How data integration works:
To integrate data, the first step is to gather it from various sources like websites, mobile apps, advertising platforms, and offline interactions. This data is then stored in a centralized location known as the Data Activation module.
It functions as a hub that consolidates all the data in one place, creating unified customer profiles across all touchpoints.
After you have collected the necessary data, the next step is to analyze it. You can examine past data, discover patterns, and highlight trends.
This analysis reveals valuable insights about customer behavior, such as cart abandonment rate, browsing patterns, demographic information and much more.
These insights give you a more in-depth understanding of your target audience, allowing you to customize your marketing strategies accordingly.
That said, you need to make sure that your analytics platform offers many integration options with the most popular marketing tools.
According to the Replacement Survey 2024 by Martech, data integration capabilities are one of the main reasons why marketers replace their current software.
3. Data activation in marketing analytics
Once the data is collected, it can be sent to various tools and platforms such as email marketing platforms, ad platforms, personalization software, marketing automation tools, or CRMs. This practice is called data activation, and it serves as the bridge between data collection and its practical application.
Data activation goes beyond mere data analysis and implements findings in real-world scenarios. This includes tailoring marketing campaigns, optimizing customer experiences, and improving product offerings.
“1-to-1 personalization is not always necessary. Especially not for the first few contacts. But we all know that the more someone is interested in us and our current needs and responds to it, the more likely we are to buy. The best current example is my bookseller. His recommendations deviate from the norm but are based on historical data. That’s why I trust him more than any ‘review’ lists. That’s customer loyalty!”
Philipp Loringhoven, Freelancer for Marketing Analytics and Strategy
By activating data, you can respond to consumer needs and market changes in real-time, leading to increased user engagement and conversions.
Practical applications:
- Create customer segments based on specific behaviors or demographics and target them with personalized marketing campaigns
- Identify potential customers who have shown interest in your products but haven’t converted, and plan steps to encourage them to make a purchase
- Trigger automated workflows based on real-time behavior, such as abandoned cart reminders or product recommendations
- Personalize website experiences dynamically based on visitor segments and past interactions
Want to learn more about data activation? Check our data activation playbook.
Digital marketing analytics: Key takeaways
We have discussed the essential metrics and reports that can help you measure and optimize your marketing activities. Hopefully, what you’ve learned will help you adapt to the new trends, come up with new ideas for improving your digital strategies, and succeed in your work.
Having an analytics platform that consists of multiple cooperating modules like Analytics, Consent Manager, Tag Manager, and Data Activation gives you practically limitless options for working with your data, from ensuring world-class data privacy to data activation and integration.
COMPARISON
The comparison of 10 web and app analytics platforms
Learn the key differences between Piwik PRO Enterprise, Google Analytics 4, Matomo Cloud, Adobe Analytics, AT Internet, Countly Enterprise, Mixpanel Enterprise, Amplitude Enterprise, Snowplow Enterprise, and Heap Premier.
Piwik PRO Analytics Suite is trusted by over 10,000 organizations, including Crédit Agricole, the Government of the Netherlands, and the European Commission. It’s built for organizations that can’t afford to compromise on data quality or compliance – giving you a single, coherent environment to collect, understand, and act on data, without the operational friction.
FAQ: Common questions about digital marketing analytics
What’s the difference between web analytics and digital marketing analytics?
Web analytics focuses specifically on website data like page views, bounce rates, and user sessions. Digital marketing analytics is broader – it encompasses web analytics plus data from all digital channels including social media, email campaigns, paid advertising, mobile apps, and more. Web analytics is a subset of digital marketing analytics. Learn more about web analytics fundamentals.
How often should I check my digital marketing analytics?
It depends on your campaign types and business goals:
- Paid campaigns: Monitor daily or weekly to optimize budget allocation and pause underperforming ads
- SEO and content performance: Review monthly to identify trends and seasonal patterns
- Overall marketing strategy: Conduct comprehensive quarterly reviews to assess effectiveness
- Critical metrics: Set up automated alerts for immediate attention when thresholds are crossed
Create custom dashboards to monitor key metrics at the frequency that makes sense for your business.
What tools do I need for digital marketing analytics?
At minimum, you need:
- Web analytics platform: Piwik PRO Analytics Suite or similar
- Tag manager: For implementing tracking codes
- Marketing platform integrations: Google Ads, Google Search Console, email marketing tools
- Consent manager: For privacy compliance
Advanced setups benefit from:
- Data activation: For unified customer views – Piwik PRO Data Activation
- Data visualization tools: For custom reporting and stakeholder presentations
Can small businesses benefit from digital marketing analytics?
Absolutely. Small businesses often have limited marketing budgets, making data-driven decisions even more critical. Start with basic metrics like conversion rates, traffic sources, and campaign ROI. Even simple analytics can help you avoid wasting money on ineffective channels and double down on what works.
Piwik PRO offers a generous Business plan that’s perfect for small businesses getting started with analytics.
What’s the most important metric in digital marketing analytics?
There’s no single “most important” metric—it depends on your business goals:
- Ecommerce sites: Conversion rate, revenue per visitor, average order value
- B2B companies: Lead quality, cost per acquisition, lead-to-customer rate
- Content publishers: Engagement metrics, time on page, ad revenue
- SaaS businesses: Trial sign-ups, activation rate, customer lifetime value
Always tie your metrics to specific business objectives and ensure they’re actionable, not just vanity metrics.
How do privacy regulations affect digital marketing analytics?
Privacy laws like GDPR and CCPA require explicit user consent for tracking and give users control over their data. This means you must:
- Implement proper consent management
- Focus on first-party data collection
- Choose privacy-compliant analytics platforms
- Be transparent about data collection and usage
The good news: Privacy-focused analytics can still provide valuable insights while building customer trust. Organizations investing in privacy see an average 1.6x return on their privacy investment.
How can I prove marketing ROI with digital marketing analytics?
To demonstrate clear ROI:
- Set clear, measurable goals tied to revenue or business outcomes
- Track the complete customer journey from first touch to conversion
- Attribute revenue to specific channels and campaigns using proper tracking
- Calculate cost per acquisition (CPA) and customer lifetime value (CLV)
- Create executive dashboards showing business metrics, not just marketing metrics
- Document wins and learnings from data-driven optimizations
Use goal tracking and custom reports to present clear, business-focused insights to stakeholders.tal marketing performance, here you can find a detailed comparison of 10 web and app analytics platforms. Download for free and see which of them is right for your needs: