
One of the most important strengths of traffic efficiency reports is that they allow you to understand exactly how your customers are finding you. Analyzing sessions, new users, bounce rates, conversion rates, transactions, and goals is pointless unless you determine where the traffic came from.
To access all those juicy details, however, everything has to be configured right. Proper URL tagging is a key element that shows you which visits are from paid campaigns and who came to your site via organic searches.
Also, let’s not forget about segmentation – without it, you can’t understand the full story behind the metrics.
To get you fully prepared for the task, we’ve compiled a few real-life applications of traffic efficiency reports. Study them to reach a new level of traffic analysis mastery.
Use case #1: KPIs on a different funnel level
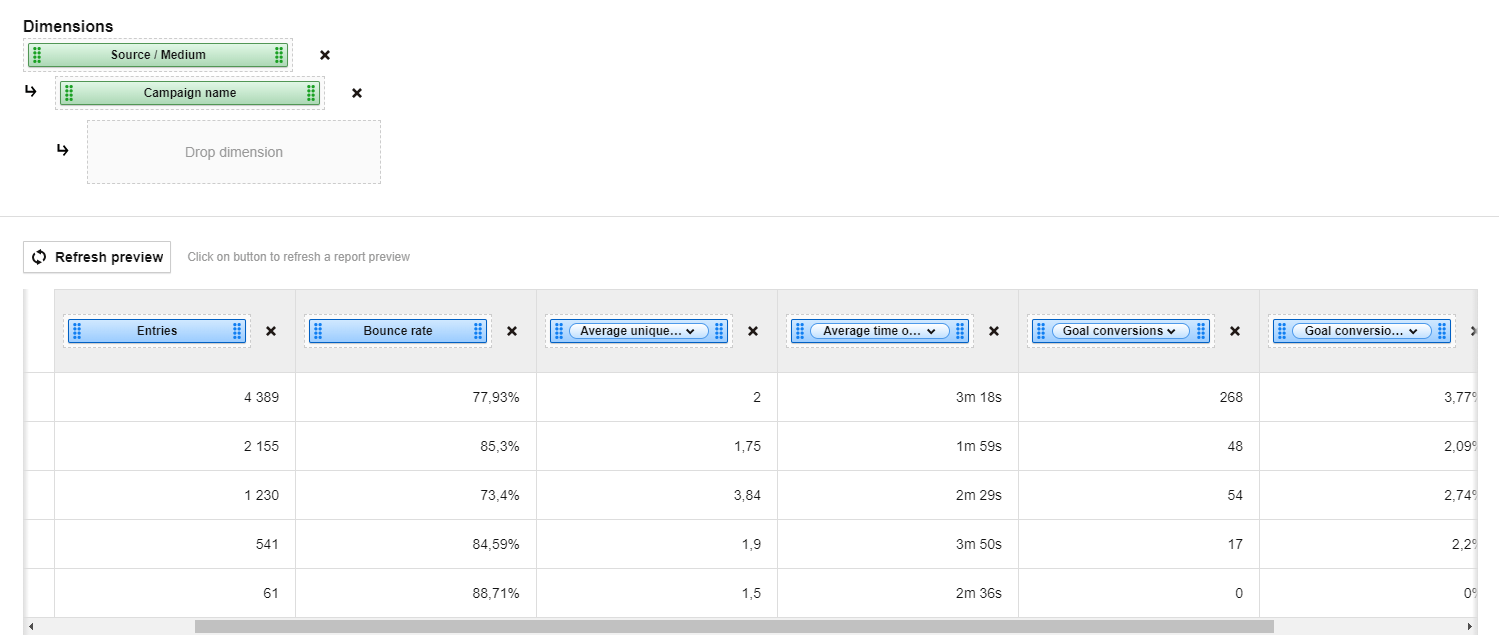
First, let’s create a basic report to show the traffic efficiency at all stages of the marketing funnel. We chose the following metrics:
- Top of the funnel
- Entries
- Bounce rate
- Middle of the funnel
- Average unique page views in a session
- Average time on page
- Bottom of the funnel
- Goal conversions
- Goal conversion rate
We’re going to segment all of them by source / medium dimension. Also, we’ll apply a second level dimension to them – campaign name. That way, you’ll see where traffic comes from and if paid campaigns are the main source.
Here’s what a sample configuration of a traffic efficiency report in Piwik PRO looks like:
And here’s the finished report:
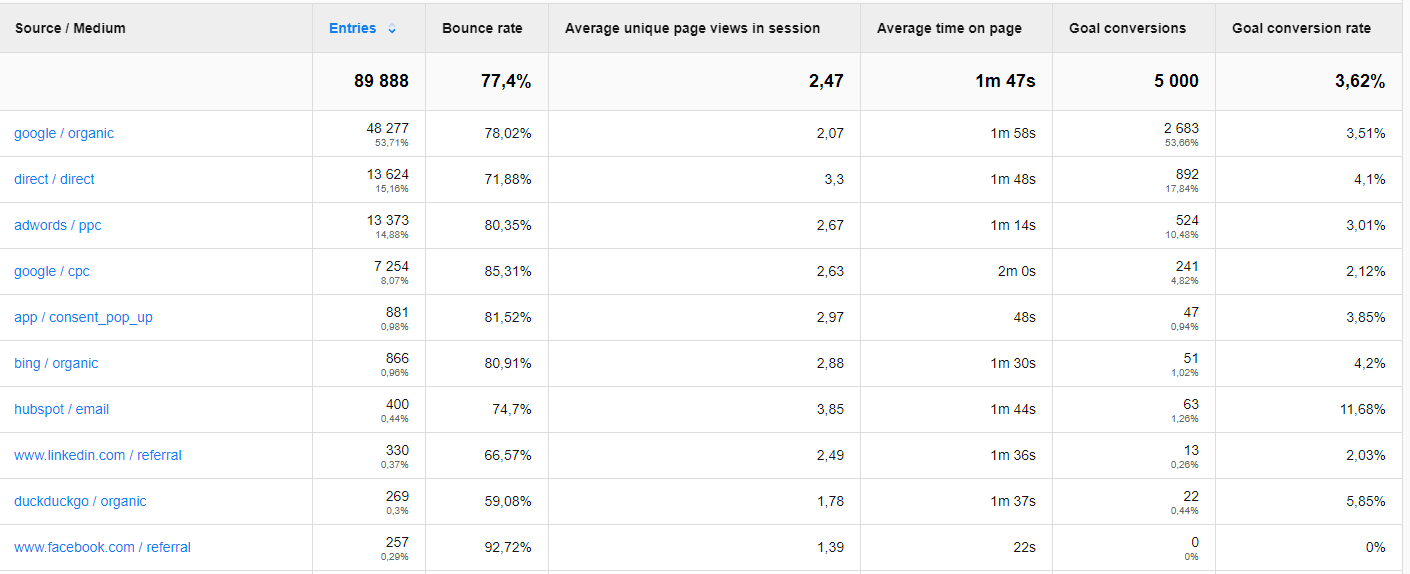
What kind of insights do we get from this portion of data? Key takeaways:
- Google organic is the primary traffic driver – over 53% of entries come via this channel
- Quality of paid media traffic (Google Ads) is not as high as organic – conversion rate is lower and bounce rate is higher
- Traffic from email campaigns (see: hubspot / email) has a high conversion rate, which is no surprise, since those visitors are already familiar with our page and our offer
COMPARISON
The comparison of 10 web and app analytics platforms
Learn the key differences between Piwik PRO Enterprise, Google Analytics 4, Matomo Cloud, Adobe Analytics, AT Internet, Countly Enterprise, Mixpanel Enterprise, Amplitude Enterprise, Snowplow Enterprise, and Heap Premier.
Use case #2: Evaluating the performance of paid media channels
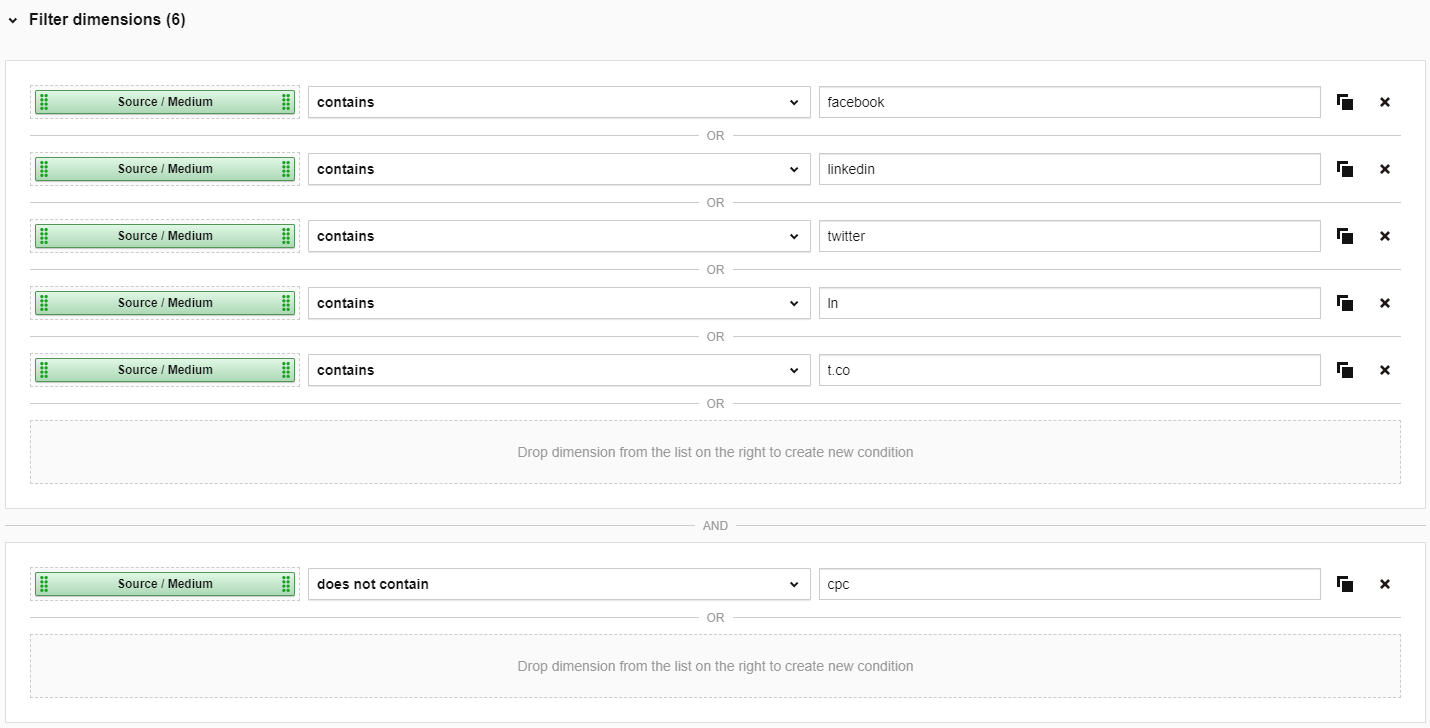
Let’s use the same configuration and filter it down so it shows only paid media channels. You can do this by adding these filters:
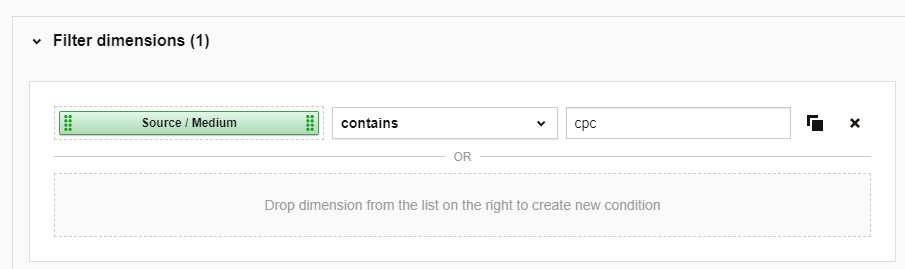
The outcome – the report – looks like this. It lets you focus entirely on analyzing paid media traffic:
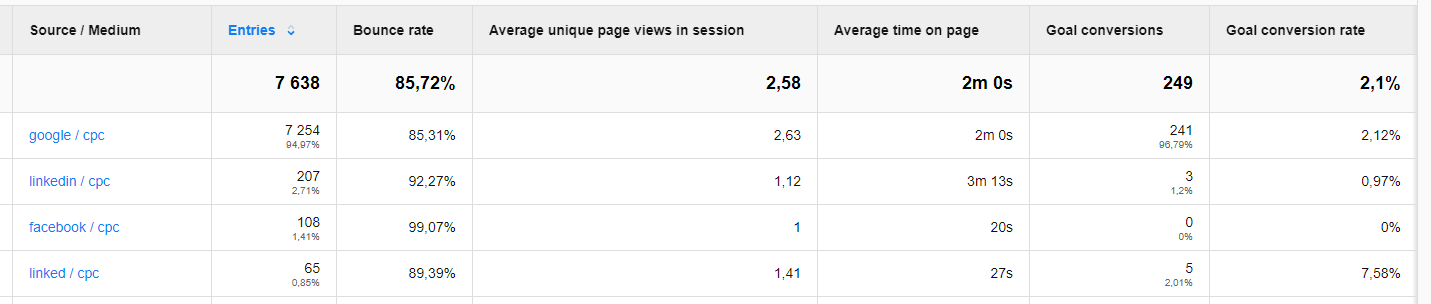
What you can see here is that:
- We’re concentrating our efforts on Google Ads campaigns – over 94% of the paid traffic is from ‘google / cpc’
- LinkedIn paid traffic has one interesting characteristic – average time on page is over 50% higher than in the case of traffic from Google Ads
- Facebook Ads traffic quality is quite poor – it brings no conversions. There’s certainly room for improvement!
Use case #3: Evaluating social media traffic
Now let’s proceed with yet another variation of our report – filtering out social media traffic. To do this, you can use a slightly more complicated configuration. In this case, we’ve included the most important social media platforms and excluded paid media traffic.
Here’s the finished report…
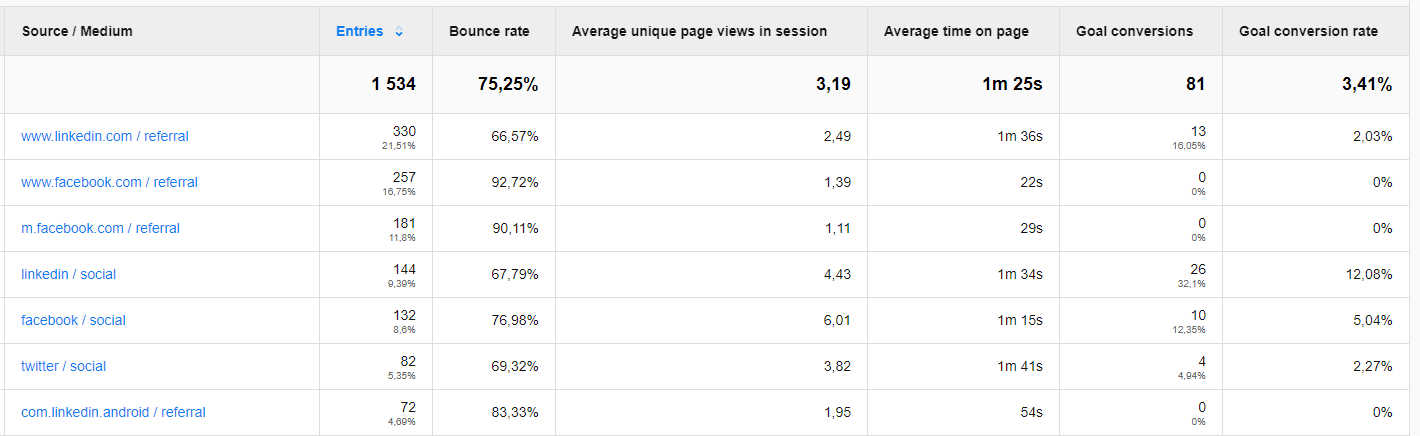
…and here are some conclusions:
- The highest quality traffic is from LinkedIn – the bounce rate is the lowest and average time on page is one of the highest among all social media channels. Also, it contributes to almost half of the conversions in social media channels.
- Tagged Facebook traffic generated over 12% of our conversions – which means that our posts resonate with our Facebook audience!
Use case #4: Analyzing traffic based on seasonality
Traffic on a site depends on many factors, one of which is seasonality. For sure, you’ve observed many times that the popularity of your websites fluctuates from month to month, day to day or even hour to hour.
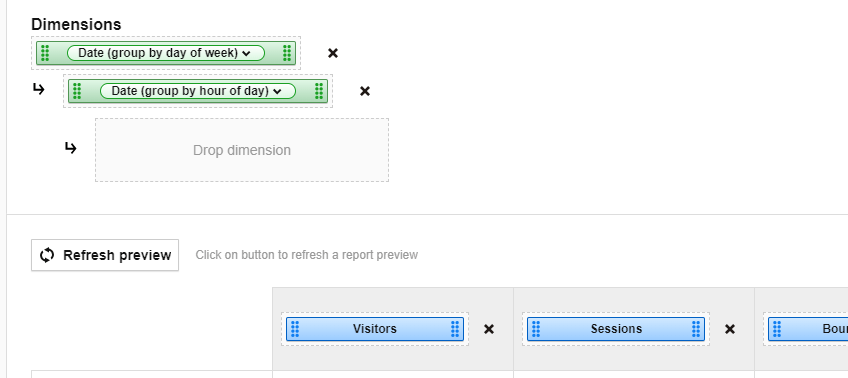
To spot these changes, let’s modify our report by applying “day of the week” as the main dimension, and “hour of the day” as a nested dimension:
Now we can analyze our daily traffic:
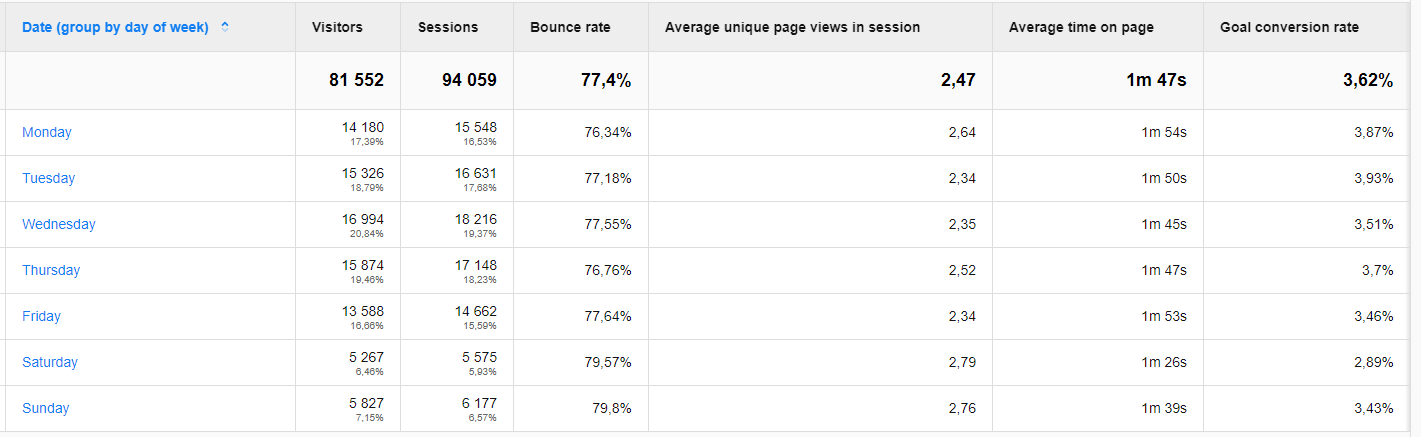
Frankly, this view doesn’t give us a lot of insights. Most of the websites with B2B products observe a drop in traffic during the weekend anyway. The rest of the metrics remain the same across the whole week.
So we have to dig deeper. Let’s analyze the organic traffic only for weekdays segmented by hour of the day. Our configuration will look like this:
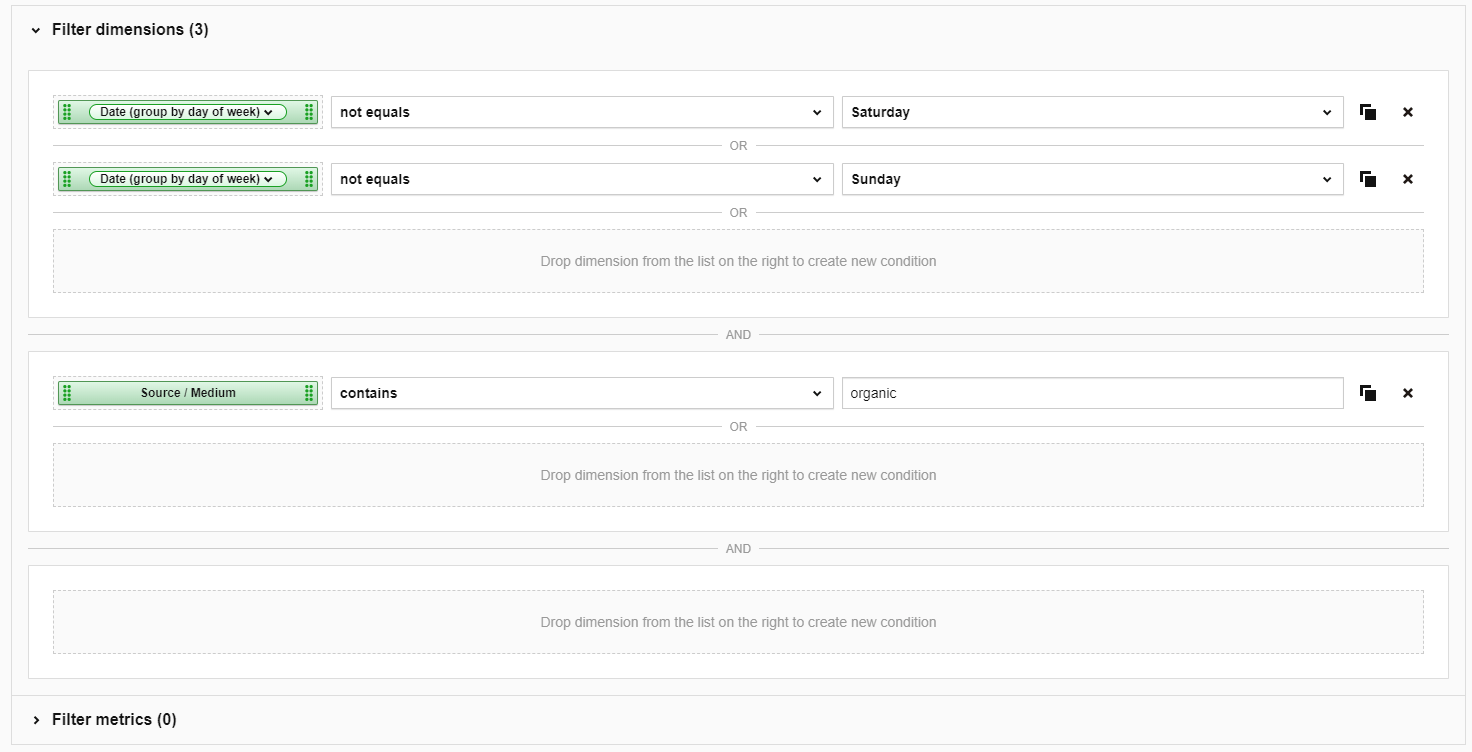
And the report itself will present the following data:
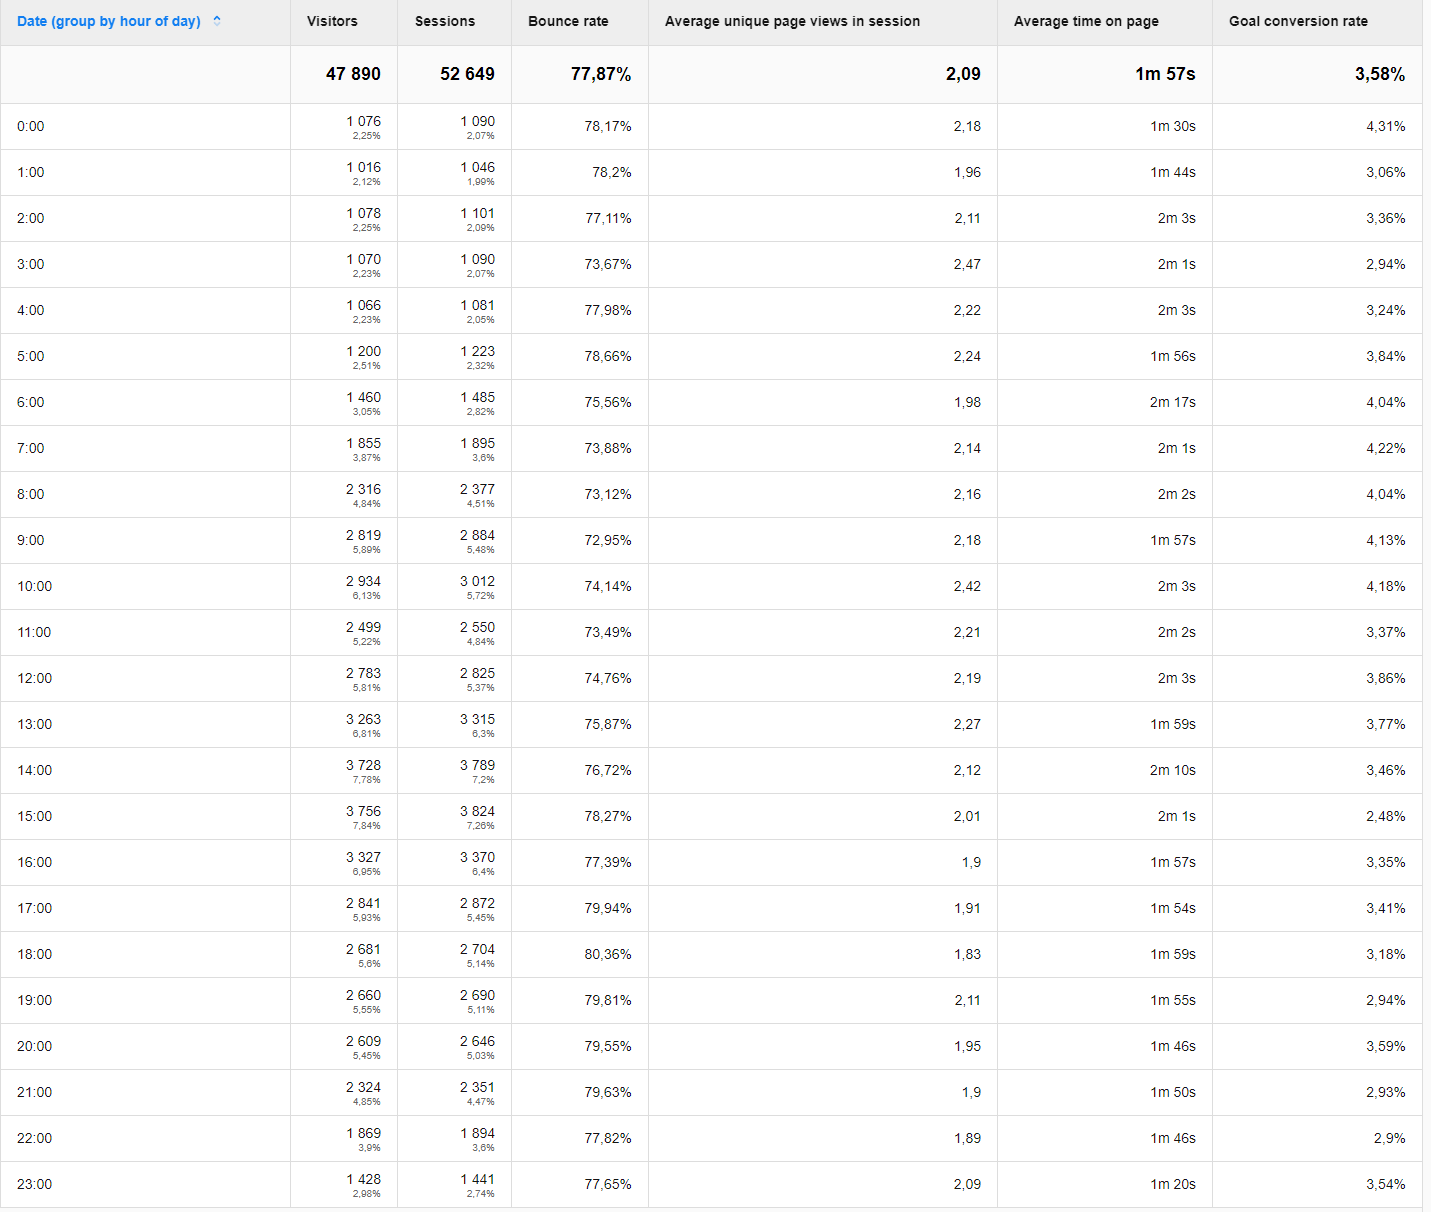
Insights from this data:
- The highest-converting users show up in the morning
- Most users visit our page in the middle of the day – around 2:00-4:00 PM
- Bounce rate and metrics at the middle of the funnel (average unique page views in session, average time on page) remain at the same level across the whole day
Traffic efficiency reports – some conclusions
There are endless ways to configure traffic efficiency reports. In this blog post, we’ve shown you some of the most basic and useful ones. However, if you’re hungry for more, our team has some more tricks up their sleeves! Be sure to contact us anytime you want.