Funnel reporting is a key analytical tool for making effective changes to your website or app. We’ll discuss how to build and analyze funnels, and then improve your customer’s journey. By the end, you will understand how to use data from those reports when you modify your company’s site to boost conversions.
Why conversion funnel analysis is important
Using funnel reporting has several benefits. You’ll see the areas of your website or app where you need to make upgrades. Analytics data from funnel reports highlights places and stages of the journey where people often exit pages. That is vital, because it tells you what places you should focus on when revamping your site. While these insights don’t directly tell you what to fix, they provide clues of great value for optimizing your customer’s journey.
Goal setting and funnel building
Setting clear business goals goes hand in hand with creating funnel reports. Depending on the type of company, those goals vary. Maybe you are interested in leveraging your social media or driving product sales. Once you have an idea of what to improve, you design funnels to help you analyze how your current website or app works towards your objectives.
Goal setting
To set up an effective funnel report, first decide on some long-term goals for your business. Possible goals could be to build your online community or to grow business from repeat customers. If one of your goals is to better utilize your social media, then apply a funnel report to measure how many people find your website via your social accounts.
Conversion funnel building
After you’ve established your business goals, brainstorm ways your website or app can help you reach them. When you decide on a path you think your customers take through your website, create funnel reports to find out how people actually navigate it. These reports show individual paths that users take.
Say you want more people to complete the checkout page or to sign up for your company’s newsletter. Thanks to a funnel report, you’ll see how visitors move through pages and where they leave. That information will help you remove obstacles and smoothen the paths for visitors.
From a technical perspective, funnels consist of steps. It’s important to add every part of the journey you analyze so you’re not missing any relevant information. For a website, use as steps events like:
- Button clicks
- Page scroll percentage
- File downloads (e.g., whitepaper, infographic)
- Requesting a demo
When analyzing how visitors use apps, the possible events are:
- Screen views
- Button presses
- Using a particular item (for games)
- Searches
Start your analysis with the focus on pages with high traffic, but also high drop-off rates. These are the areas you’ll want to improve.
Keep in mind, it’s natural to see a drop-off in the number of customers in a funnel. Not everyone who visits your site is going to buy something or complete a transaction. However, funnel reports give you data that enables you to take necessary actions to raise conversions.
Read more about funnel reports in: Funnels based on behavioral segmentation: a little-known way to map the entire customer journey
Now, let’s take a look at different examples of how people navigate your website.
Use case #1: Visitors move from the homepage to the product page, ending in a demo request
You have planned a customer journey with these steps:
- Someone visits your website. On your homepage, they have an overview of your business and services.
- If you’ve captured their attention, they enter the product page to find out more.
- If they like what they see, they request a demo. This is the final step of the conversion you had in mind.
Depending on the outcome you’re interested in, you can choose a different last step. For example, you want the journey to conclude with the visitor making a purchase. Or you have a more complex process, where you break down the demo request into the following steps:
- clicking the request link
- filling out the form
- hitting the submit button
The key is that you have a mapped-out process with multiple steps for measuring progress.
To see if customers followed your planned journey, set each event as a step and consider the structure of your website.
In this example, the first step could be any of your product pages:
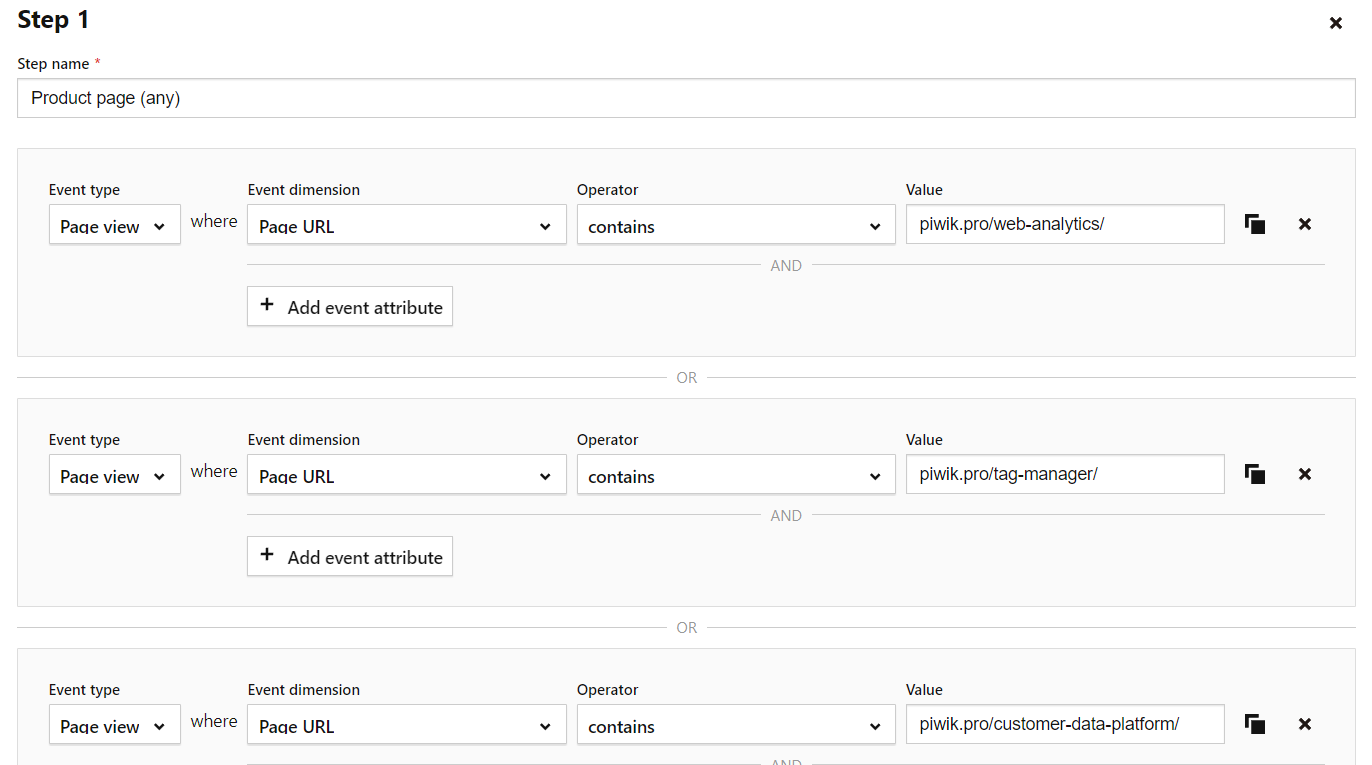
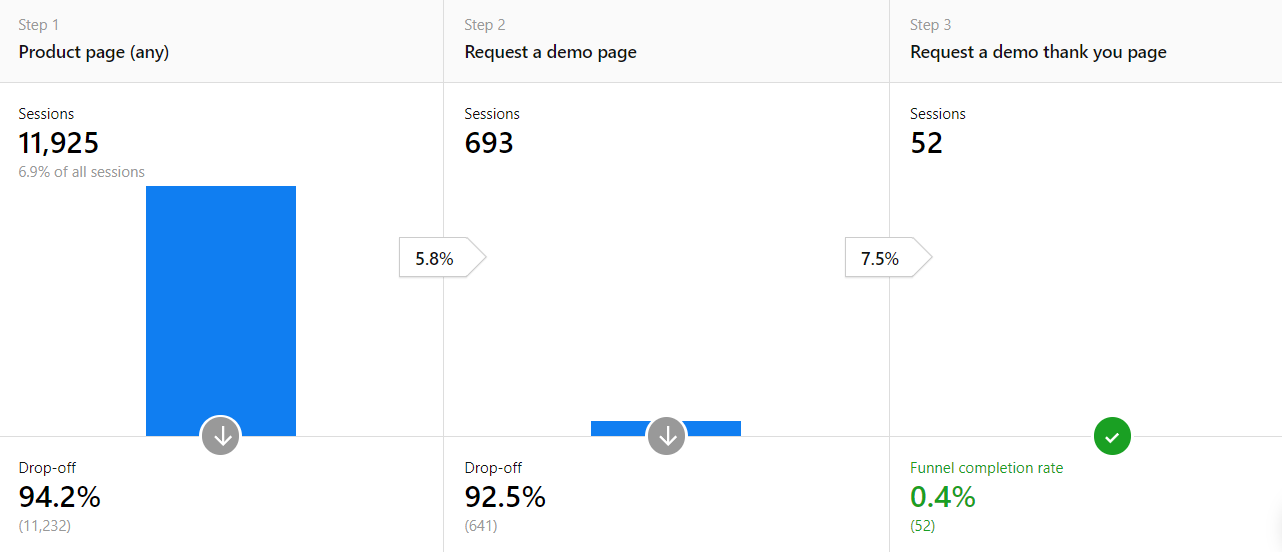
Here, it’s possible to check how many people are going from product pages to a demo request page with a form.
You could also duplicate this report and change the first step to a different part of your website, such as to your homepage or a blog post.
Use case #2: Users submit contact information
In this use case various events, not different URLs, work as steps in the customer’s journey. In addition to different web pages, you’re able to use custom events. Some analytics platforms also use virtual page views to build funnel reports.
For this journey, you’ve designed a landing page with the goal of capturing leads via users submitting their emails or other contact information. Form optimization and funnels make a great match. You can see, field by field, where visitors lose interest and where to make changes. Your steps might look like this:
- A visitor lands on the contact page.
- They click on a button that scrolls them down to the contact form, and they fill out the form.
- After submitting their data, the visitor reaches the thank you page.
That means your goal has been achieved.
For long forms requiring a lot of information to fill out, divide the fields into multiple pages so you don’t overwhelm the visitor. Then, your funnel’s steps would include reaching the next page(s) and all resulting fields.
Analyze your conversion funnels
After you’ve created your funnel reports, you can spot places with technical or design-related issues. While you won’t know exactly what’s causing visitors to leave a website or abandon their cart, you know which page to look at.
The easiest way to check on those pages is to visit the site yourself to verify if the interface is uncluttered and working properly. For example, check your drop-down menus and buttons for technical problems.
It’s also important to see if the website’s navigation is clear so visitors don’t get stuck. They could be clicking on the wrong part of a page. Using your site to collect information about visitors and their interests is one part of the process, and digging into analytics data is the next step.
To visualize what analyzing funnel data looks like, let’s examine the following case.
Use case #3: Using an online tool with email confirmation
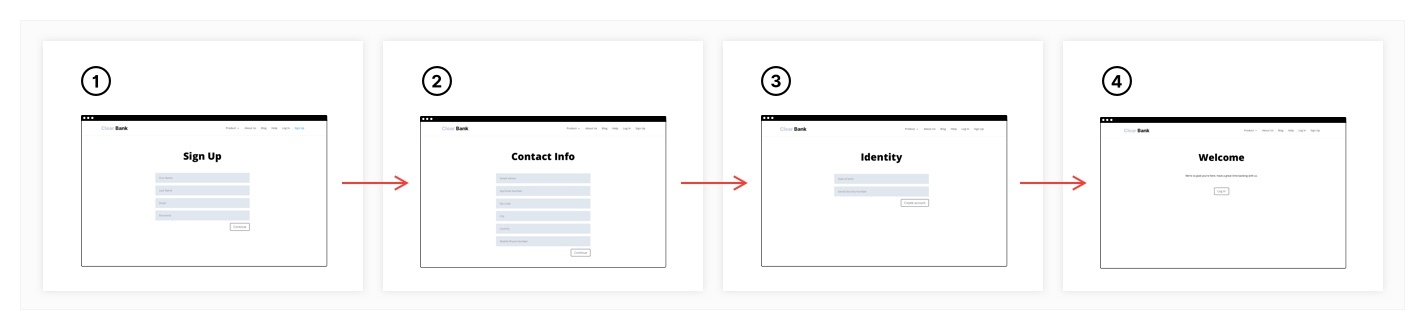
In this use case, we will discuss a scenario of renting a car online.
- The visitor fills in an online form, indicating in which city they’ll pick up the car.
- The second page gives the visitor options, such as different models and the dates available. To register for the car, the visitor must provide an email address.
- The final page is a confirmation that the information about the rental has been sent to the visitor’s inbox.
This way, you visualize the whole process, then check for any potential bottlenecks.
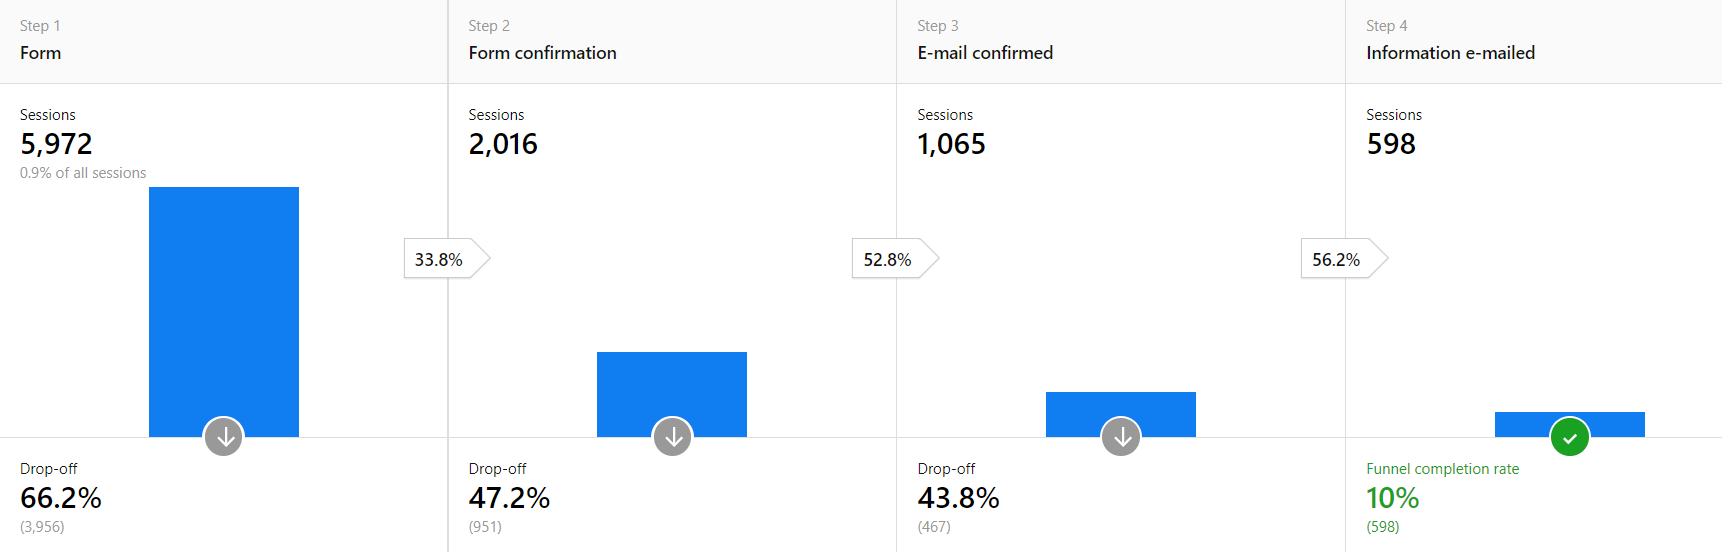
A significant drop-off after the first step is expected. Not everyone is willing to share their contact information.
However, the drop-offs after steps two and three shouldn’t be as high as shown here. If someone’s already filled out the form, most people would finish the process to get the information they want. This funnel report lets you discover places with potential issues.
Once you’ve identified these problem areas, it’s time to enhance your website or app. For instance, if you find you are losing visitors after the trial stage of your product, you may need to expand or refine the onboarding process.
Or, visitors leave without completing the form. The cause might be that the form doesn’t display all the fields, the form refuses special characters or letters, or the instructions are unclear.
How to utilize funnel reporting to make improvements to your website or app
The analysis of your funnel report enables you to understand which elements of your process you can improve to achieve more conversions. Depending on the nature of the problem, consider the following courses of action:
- Enhance the user experience for different devices and operating systems. Let’s say you apply a device type segment, then you find that the majority of drop-offs come from mobile users. This could mean your site doesn’t have a responsive website – maybe the drop-down menus don’t function properly, or your images don’t display correctly on a mobile device.
- Add triggered pop-up windows with free shipping or a discount code to your remarketing campaigns, offers, and push notifications for users who don’t complete funnels.
- Exclude problematic segments and audiences from your campaigns, such as high traffic from a certain country, but one where visitors don’t convert. That’s a clear signal to remove that demographic from paid promotion. This way you decrease the acquisition cost for these groups and increase the effectiveness of your marketing initiatives.
Doing follow-up research: testing your ideas
After you’ve reworked your website, periodically monitor your page views, bounce rates, time on page, and so on, to see if your modifications are working. Give the changes time to build up enough new data before analyzing your traffic and website performance.
Read more about enhancing your website in: 10 things to consider for improving user experience with web analytics
Remember, it’s good to customize funnel reports for different visitor groups and browser types. It’s also possible to adjust those reports to your business and the type of goals you want to measure.
All that being said, funnel reports will point you in the right direction of what places to start working on to improve conversions from your website or app.
If you’d like to find out more about analytics platforms that help you with funnel reporting, see our articles and comparisons: