Marketing campaigns and search engine optimization use high quality content that targets prospects and drives them towards conversion. Getting the attention of potential customers is a significant milestone, but tracking the performance of your marketing efforts and accurately attributing conversions is critical to manage and improve your campaigns in the long run.
You’re falling short of your potential any time you start a marketing project without the ability to track its effectiveness and optimize it over time.
How can you keep an eye on your campaigns and see what’s working or underperforming, and where improvements can be made? In this post we’ll talk about how using custom reports from your analytics data helps you stay vigilant and ensures you’re spending money wisely.
First let’s take a look at how you can monitor your search engine optimization (SEO) results with a variety of reports.
Tracking SEO and content campaign performance
When you apply SEO to your content it helps drive organic traffic to your website. Paid campaigns, on the other hand, bring in non-organic visitors and need to be monitored to ensure you’re getting your money’s worth on ad spend.
Optimizing your content to show up in SERP is an accomplishment in itself, but the question remains: how can I tell if it’s achieving the goals I’ve set? SEO campaigns require constant strategizing, analysis, and tweaking. It doesn’t stop when you get your content in Google’s Top 10.
By setting up custom reports in your analytics you can track your SEO and campaign efforts as they relate to:
- Performance in search engines
- Traffic driven to your website
- Resulting goal conversions
- Keyword metrics (with Google search console integration)
Monitoring your website’s traffic
Increasing entries to your website is a fundamental goal of SEO and your campaigns. You can hit your marks by setting up reports to monitor traffic at all times, keeping you always aware.
You can create a report like the one below to display site traffic on a daily basis. This is useful for gaining instant insights and taking fast action. Unusual spikes or drops, for example, can result from bugs on the website or changes made to the code in a recent update. Keeping an eye on these numbers every day allows you to quickly find such issues and get ahead of them.
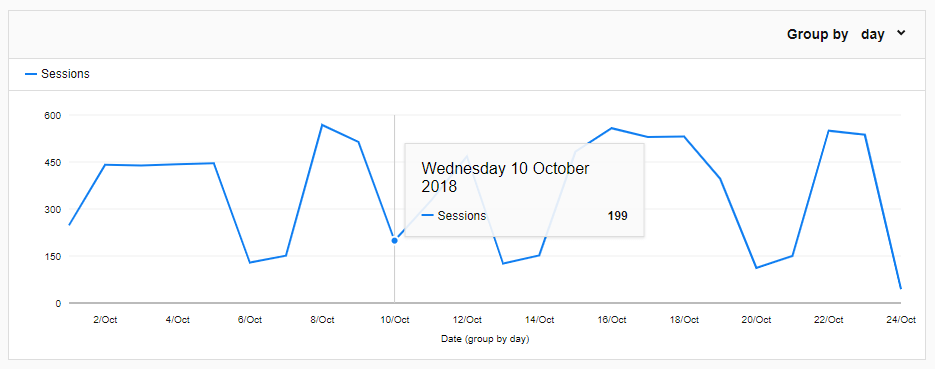
You can see in this report a normal fluctuation in visitors for B2B sites: peaks during business days, craters on the weekend. Looking at this report it’s easy to see that on Wednesday, October 10, there was an unexpected drop in traffic.
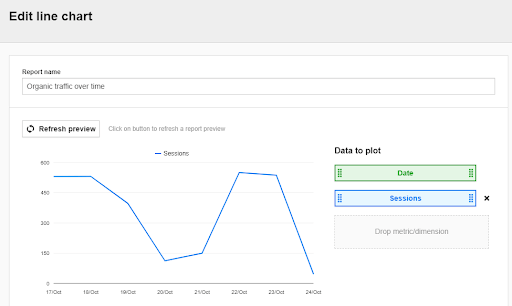
Configuring this report is a straightforward task – just choose a line chart report, select “date” as the dimension and “session” as your metric.
You can apply a filter that will only show you organic search engine traffic data:
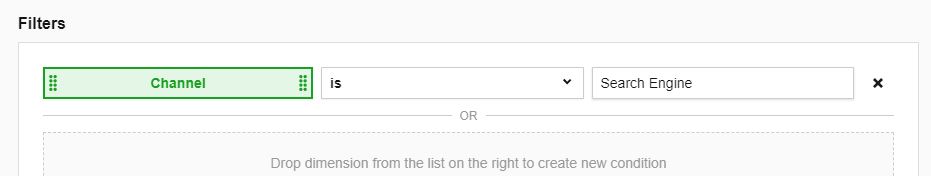
This report is great for getting a quick overview of general search engine traffic and the effectiveness of your campaigns.
Now let’s see how effectively your content is performing, both individually elements and as a whole.
Tracking your content’s effectiveness
The primary function of SEO is to increase your visibility in search results and lead people to your website. Analyzing search engines as a traffic source can provide many of the pieces needed to create an image of customer behavior and intent.
Knowing your overall traffic and which particular pages are being entered will help you with creating new content and optimizing what already exists.
For example, let’s say you’ve got a high-quality blog post, but you’re just not seeing the numbers you expected. Now that you’ve spotted the issue, you can investigate and find ways to optimize that page from an SEO or content perspective to get the traffic you want.
Reports for content effectiveness include:
- Traffic generated by each search engine
- Top performing pages
- Entry pages
Search engine analysis
In the case of SEO you want to monitor traffic that comes from search engines exclusively. How can you tell which engines are contributing the most traffic, and, more granularly, which pages those users are entering from?
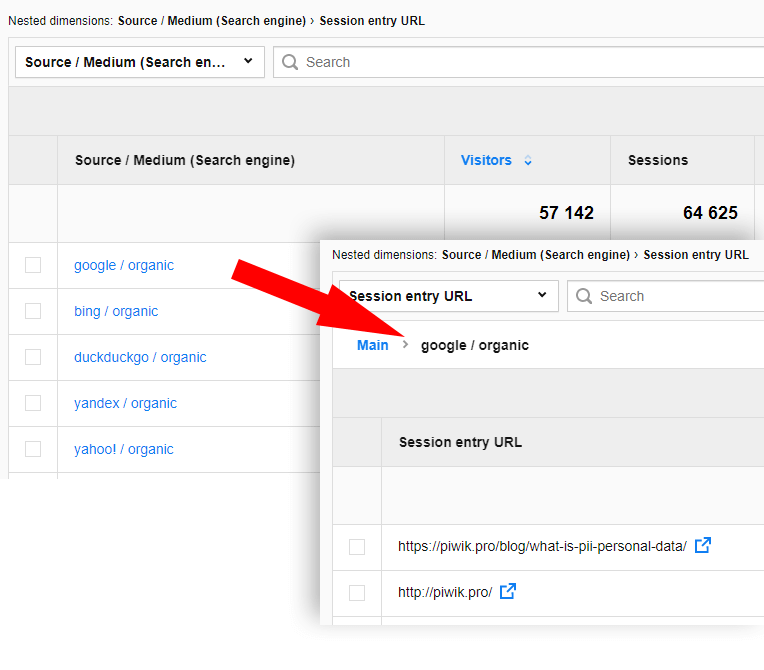
You can accomplish this by creating a report with nested tables. The first gives you an overview of search engine traffic. The second drills down into each source you can see data on individual entry pages from the given source.
Going down to each search engine, we can see entry pages by their URL. You connect the dots of your user’s journey and discover which keywords led them to your page.
Organic traffic: Top performing pages
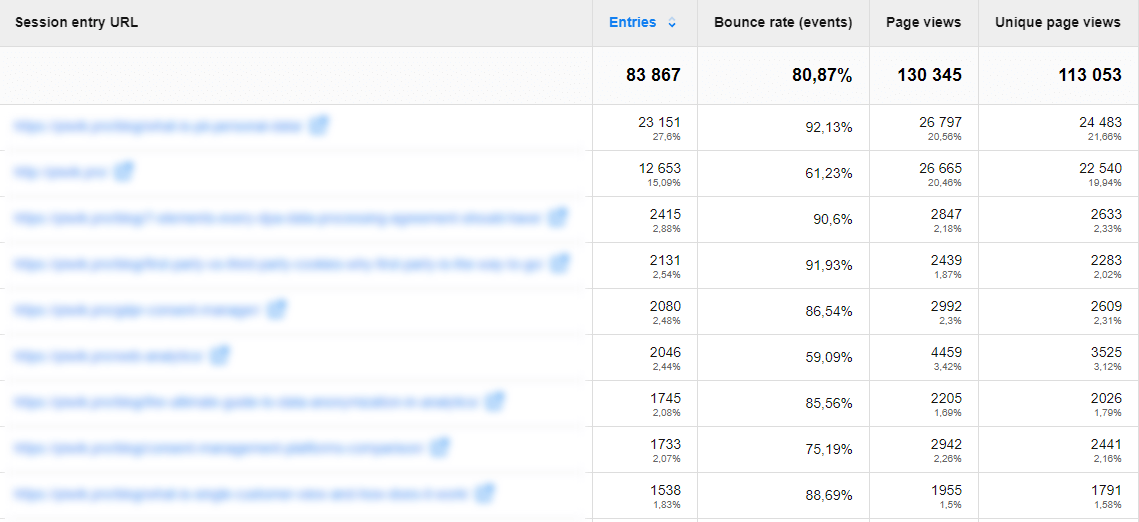
Here’s a solution for monitoring organic traffic metrics for your pages. It’s useful to have all this information about individual page performance in one place. Entries and time on page indicate how engaging your content is, and bounce rate shows if users are going deeper into your site after this page or leaving.
This report below not only shows your most popular pages, but also how visitors are engaging with every page of your website.
Google Search Console integration
Google Search Console is an effective tool for getting information about your site’s visibility and traffic. It can be used for learning more about your website’s relationship with Google and its search engine results.
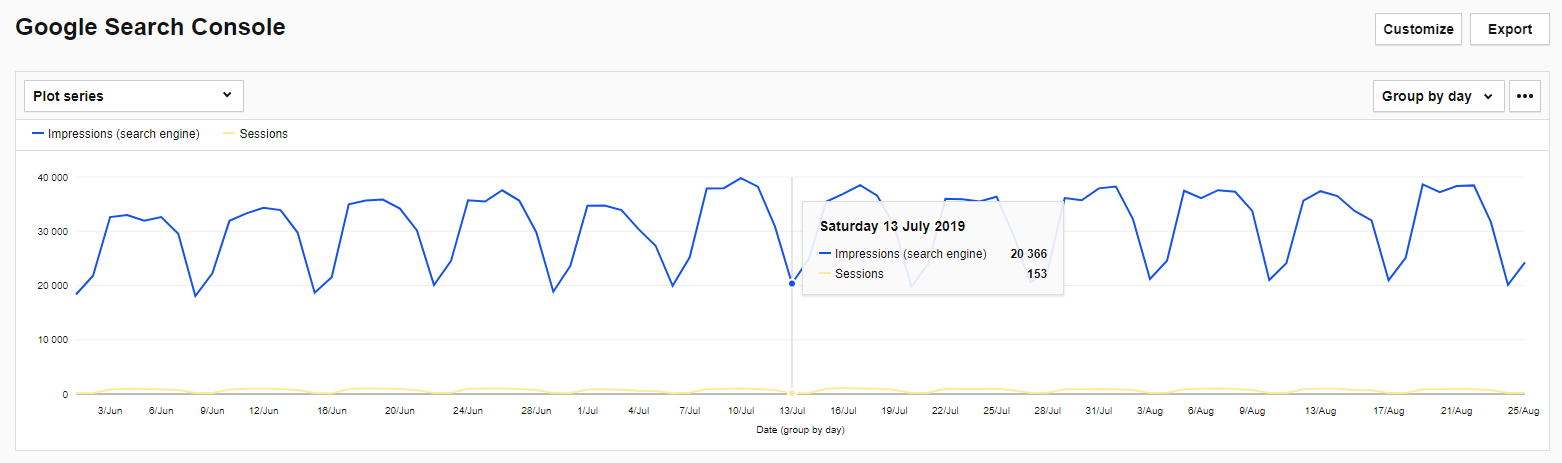
Integration with GSC connects search engine visibility data with your metrics from Piwik PRO. This shows how many people see your site in Google’s results and sessions that come from searches.
For example, the report below displays Google impressions and page sessions. This gives you an understanding of how visible your pages are versus how often people choose them from the SERP.
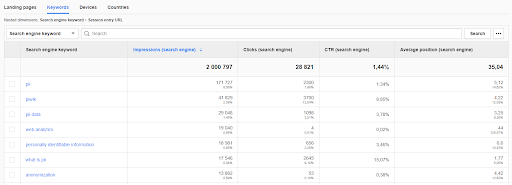
You will also find useful data about keywords that drive traffic to your website while eliminating the problem of “No data” appearing as the “keyword” in custom reports.
Keyword reports in the integrated Google Search Console shows us keywords with metrics like:
- Impressions – how many times your website is displayed in SERP using a keyword
- Clicks – how many times your result in SERP gets clicked using particular keyword
- CTR – percentage of clicks to impressions
- Average position – the average ranking of your website for each keyword
Tracking paid campaigns
Now with SEO monitoring covered let’s move to non-organic efforts. When it comes to paid campaigns you run the risk of wasting money if you aren’t aware of their performance. Running a tight ship and making sure you’re spending budget strategically requires real-time feedback that provides clear results and insights.
COMPARISON
The comparison of 10 web and app analytics platforms
Learn the key differences between Piwik PRO Enterprise, Google Analytics 4, Matomo Cloud, Adobe Analytics, AT Internet, Countly Enterprise, Mixpanel Enterprise, Amplitude Enterprise, Snowplow Enterprise, and Heap Premier.
Campaign URL tagging
Before you can do anything with your analytics data you need to make sure you’ve tagged everything correctly. Proper URL tagging is a crucial step in tracking your marketing efforts. Tags allow you to track and differentiate incoming users. For example, when running a paid campaign on Facebook, if you use an untagged URL your paid and organic traffic will all show up together as Facebook referral.
Properly tagging campaign URLs is a sure fire way to avoid messy reports and keep incoming visitors organized. Once you have your links properly tagged you can discover a lot about your campaigns.
The easiest way to tag URLs properly is by using a builder tool like this one:
Source/Medium and individual campaign performance reporting
Let’s start with a report that handles all your source/mediums and the campaigns within them. Checking the overview of all your sources/mediums and also drilling down to individual campaign performance requires an in-depth, all-in-one report. One that shows you how much traffic sources like Google Ads, Facebook Ads, Hubspot, etc. are pulling in, and to get granular and see the results for every campaign.
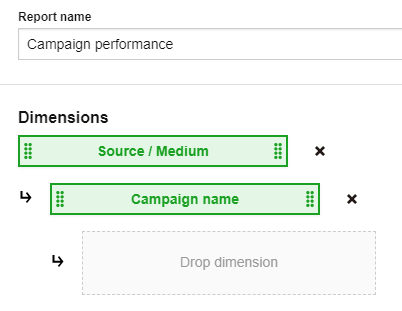
Let’s take a look at how to configure this report in Piwik PRO:
After choosing the explorer report you use two dimensions: “Source/Medium” and “Campaign Name”. Choosing two dimensions creates a nested table that lets you zoom in from high altitude and see individual campaigns.
The metrics you choose are specific and strategic because they provide insights into campaign performance.

Pick metrics that best align with your goals, here’s why we chose these:
- Entries – How many users came to your website via this campaign. Traffic is a fundamental indicator of success.
- Average time on page – How long people spend on a page can tell you how engaging the content is. You’ll be able to analyze pages with high time on page and try to duplicate that success. On the other hand, underperforming pages can be reviewed for potential improvements.
- Bounce rate – Percentage of immediate exits from all visits.
- Goal conversion – Goals you set up beforehand, these are actions you want visitors to take when they visit your site. Some examples are form submission, button click, purchase completed, certain time on page, etc.
- Goal conversion rate – The number of conversions divided by the number of visitors.
5 conversations / 250 entries = .025 (2.5%)
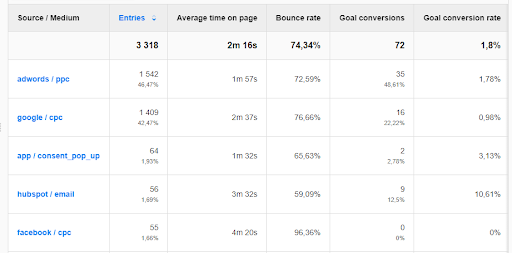
After applying a filter that only shows tagged campaigns, you get an overview of the aggregated data.
Selecting an explorer report and using two dimensions creates a nested table. You can navigate within each source and get down to the individual campaigns:
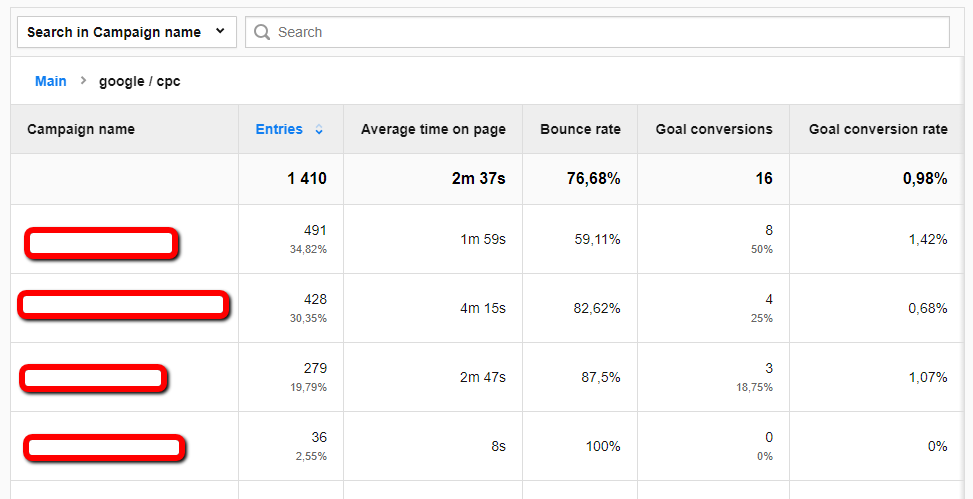
This report works well not only for monitoring the channels you’re active on but also specific campaigns. You’ll be able to spot trends and tell which campaigns and sources work best with your efforts.
Monitor goal conversions
Tracking goal conversions is an important aspect of your web analytics efforts, and you may find yourself wanting to do this on a daily basis. For example, you have high ad spend on a new channel you’ve never used and you want to see positive return ASAP. You’ll need a marketing performance report that shows and tracks goal conversions day by day.
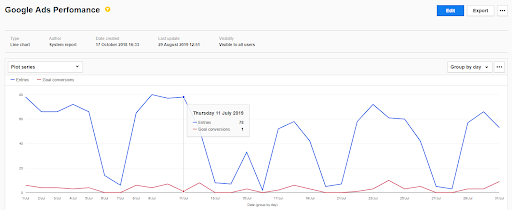
You need to filter the data to see only campaign-specific information. In this example we’ll look at how Google Ads is performing as a source.
Setting up filters:
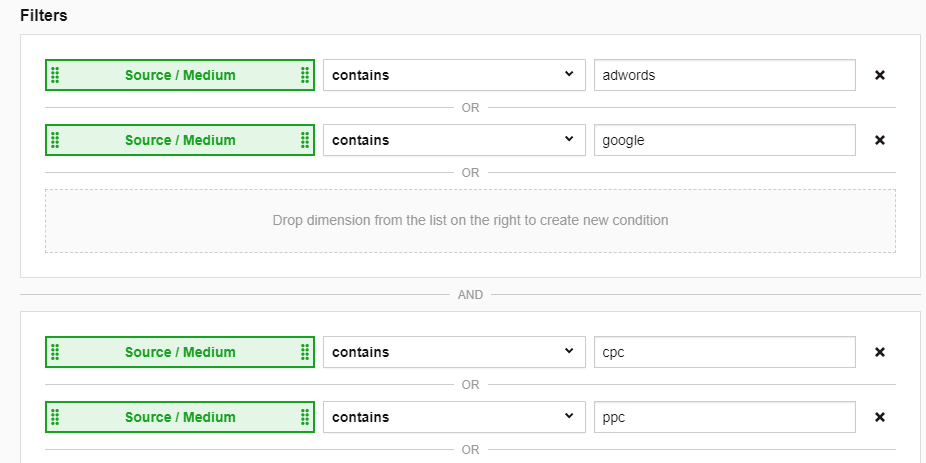
These filters only show the information using the adwords / cpc and google / ppc tags that you set up beforehand when rolling out the campaigns. You can see how the URL tagging we detailed earlier has come full circle and is critical in implementing this report.
Conclusion
Don’t blindly implement campaigns without knowing if they’re working or not. You can see the tools are available to monitor your SEO and marketing efforts and gain valuable insights about what’s working. The more you know, the more you can optimize over time and maximize your data applicability. Remember that analytics solutions reach their full potential when aligned with the specific goals of the company in hand. For more information about tracking, better understanding, and getting the most out of your marketing reach out to us.