
If you are running an online shop or work for one, you probably already know how important it is to get the numbers right. Actually, if you are in the e-commerce business, you can get quite overwhelmed by the number of different metrics and measures that you are supposed to follow and base your decisions on, all while trying to avoid going crazy along the way. But really, the things every e-commerce owner needs to know are which metrics are the most important and which really should be the centre of attention.
So, what is more important – daily revenue? Daily gross margin? Or maybe you should only focus on the conversion rate? Below are 5 important e-commerce metrics to track on a daily basis that will help you see the big picture of your business and help you make smarter decisions.
And if you want to come back to details of e-commerce analytics in Piwik PRO be sure to check out our User Guide.
1. E-commerce conversion rate
It will come as no surprise that we open our list with the most obvious ecommerce metric – Conversion Rate. This metric has gained huge popularity over the years and there are very good reasons why; it is simple, it is easy to understand, it is being tracked by most web analytics tools (it is also present in Piwik) and more importantly, it provides so much valuable information about the condition of your business.
The e-commerce conversion rate is calculated as a percentage of total visitors who eventually end up buying from you. So, if on a particular day your e-commerce website is visited by 1000 users and 12 of them become paying customers, then that means that on this particular day your e-commerce conversion rate was 1.2%. Most studies suggest that the average conversion rate for most e-commerce sites is between 1% and 2%, however, there are some successful online retailers with a conversion rate over 5%.
The reason this metric is so powerful is because it tells you, in real time, how efficient your offer to the customers visiting your shop is. It also tells you which marketing channels are providing you with the most value. For example, if your Facebook campaign has a conversion rate of 1% and your PPC campaign has a conversion rate of 3%, then the conversion rate will help you make the right decisions when it comes time to creating your marketing budgets. We could write the next 10 posts solely about the conversion rate, but there are also some other interesting e-commerce metrics, so let’s move on.
In addition, a comprehensive PPC audit checklist can be invaluable for ensuring that your pay-per-click campaigns are optimized for maximum efficiency and effectiveness. By regularly reviewing this checklist, you can identify areas for improvement and make data-driven decisions to enhance your overall marketing strategy.
Free comparison of 5 leading web analytics vendors
Compare 40 differences between 5 leading enterprise-ready web analytics vendors:
2. Cart abandonment rate
This metrics is very closely related to the conversion rate. The cart abandonment rate applies to all your customers who visited your shop, navigated their way to the product page, added a product to the shopping cart and then left. They leave your shop without spending a single dollar. So basically, the cart abandonment rate is the percentage of visitors who add products to your shopping cart but in the end do not purchase anything and leave your shop.
For most e-commerce websites, this number varies from 40% to 60%. For a large majority of e-commerce owners, the most common struggle they face is lowering the number of customers who abandon their carts. There are many blog posts, optimization tips and even books on this topic, and the most successful online shops have been optimizing their shopping carts to combat cart abandonment for years now.
3. Average order value
Another metric that is often a topic of e-commerce optimization is the average order value. While the conversion rate will tell you how many visitors convert to paying customers, the average order value will tell you how much a single customer is willing to spend during one visit to your store. However, this metrics is a bit tricky, as it seems like it does not carry much information and many shop owners think that it is very hard to optimize this metric. As it turns out, they are often wrong.
The average order value will tell us how much we can pay to acquire a single customer and still be left with some profit. The more the customers are willing to spend during a single visit, the more we can spend on our marketing campaigns, the more commissions we can give to our affiliates and partners, etc. The average order value can also be optimized using various sales techniques taken from brick and mortar stores. The most popular optimization techniques involve upselling and cross selling.
4. Customer acquisition cost
When we talk about the average order value, we cannot go without mentioning the customer acquisition cost (CAC). This is one of the metrics you will often have to calculate on your own as most web analytics tools only provide you with a CAC value for the customers acquired via PPC campaigns. For customers acquired via other traffic sources, you will have to calculate this value on your own. But this makes it even more valuable for you and gives you more business insights. The most basic formula for this metrics is:
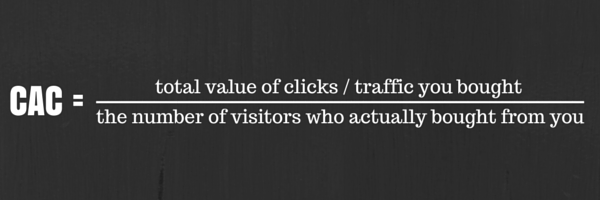
You should always compare this metric to the average order value (AOE) to ensure you are not paying more for acquiring a new customer than they are willing to spend in your store. This is metric (CAC) is extremely valuable when comparing the different marketing channels, for example Facebook vs SEO.
5. Customer lifetime value
Finally, we have arrived at the most complex and often the most overlooked e-commerce metric – customer lifetime value. CLV is in many ways a younger brother of average order value. AOV is sometimes a misleading metric because it assumes that a single customer will only buy from you once. CLV assumes that some customers will come back at some point in the future and make another purchase. So, an acquired customer during a long period of time will often buy from you more than once or twice.
CLV is projected revenue that a customer will generate, as long as he keeps coming back to your e-commerce website. What implications will this have on your business? Let’s take a look back at the average order value and customer acquisition cost. We were comparing those two metrics to see if paying for a new customer is profitable for us or not.
Now let us imagine a situation where we are paying more for a new customer than he will spend during his first visit. Why would we do that if we want to be successful and profitable shop owners? Perhaps because we know the CLV value and we know that this customer on average will come back and spend three times more than what we paid to acquire him.
Conclusion
Of course, there are many more e-commerce metrics than the ones we have presented here, but those 5 will cover most of the information you need to analyse in order to know how your ecommerce business is performing. Measuring eCR, CAR, AOV, CAC, CLT on a daily is a must for every e-commerce owner.
5 leading enterprise-ready web analytics vendors
Compare 40 differences between 5 leading enterprise-ready web analytics vendors: