
All online cart owners have been there. We’re all probably familiar with this type of story no matter the type of products we offer. Our users browse the catalogue, examine the products on offer and make comparisons. They select some products, add them to the basket, then perhaps add a few more. They might even confirm and proceed to the checkout, but somehow… the sale never actually happens.
Luckily, with web tracking tools you can get your hands dirty digging through the exact data you need to sort your sales process out. In this post we’ll discuss how to use smart segmentation and funnel reports to your advantage and get more out of your marketing budget. And yes, it’s easier than you think!
Step 1: Reality Check
First of all, it’s important to assess what goes wrong and at which stage of the shopping process. In other words, we need to identify the main bottlenecks on the road to goal conversion. That’s where implementing conversion funnel reporting comes in handy, and it’s quicker and easier than you might think.
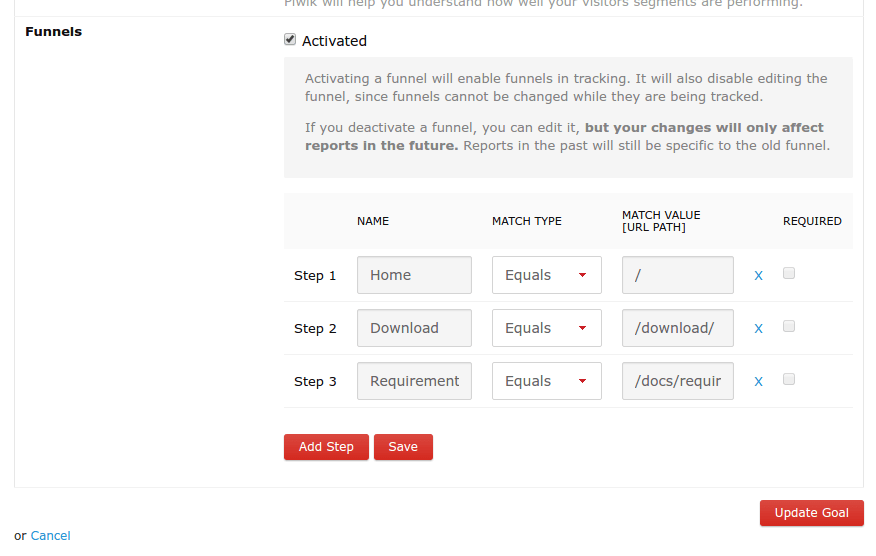
To define a new funnel, visit the Goals > Manage Goals page and add a goal. When the Funnel Analytics feature is activated, you will see a new section at the end of the form. Here, you can add and remove steps from your funnel. This is how it looks like:
Optimize Piwik’s Performance Issues: A Free Guide
Learn how to boost Piwik’s reporting speed and strengthen web analytics data security:
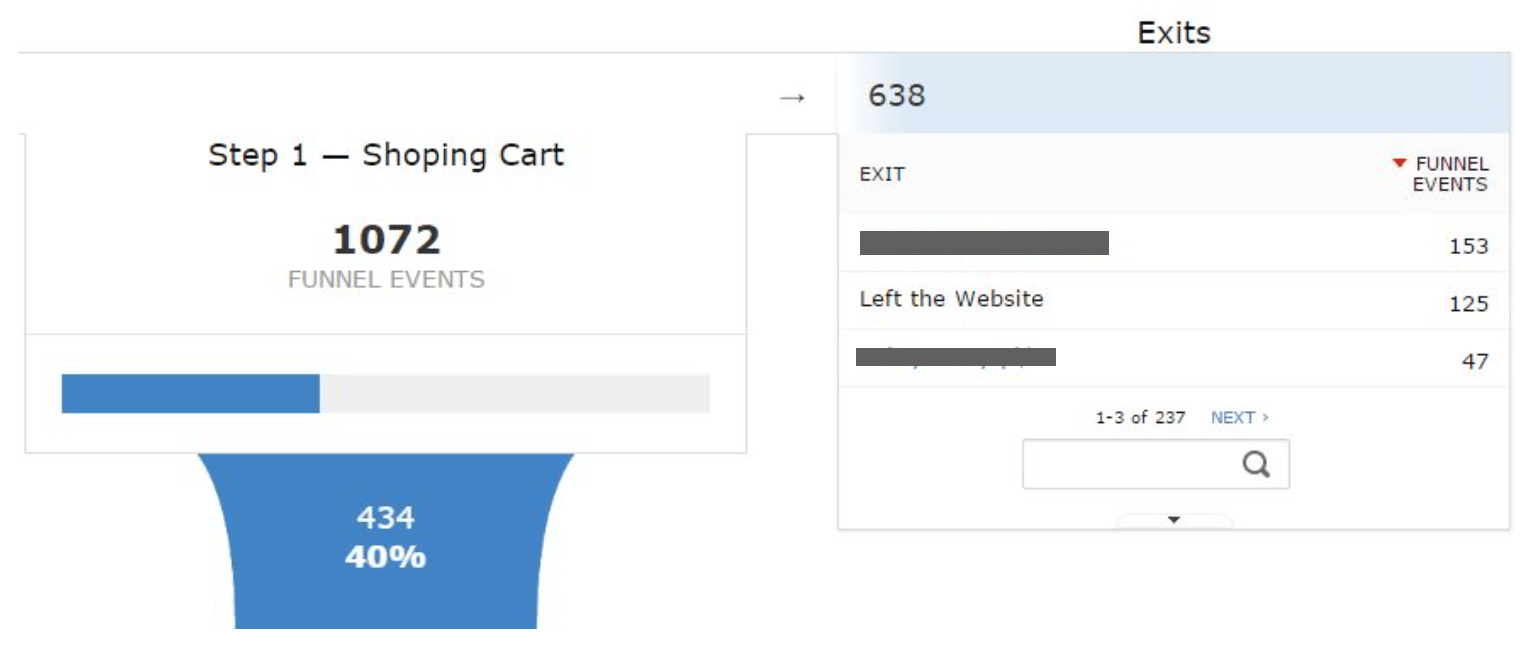
Once your funnel is up and running, you can observe how many of your visitors actually complete all the steps required along their way to goal conversion. It may come as a bit of a shock at first to learn that your store is recording a 60% abandonment rate, as in our example below. But let the numbers tell you the real story, then use them to your advantage.
Step 2: Name, don’t shame
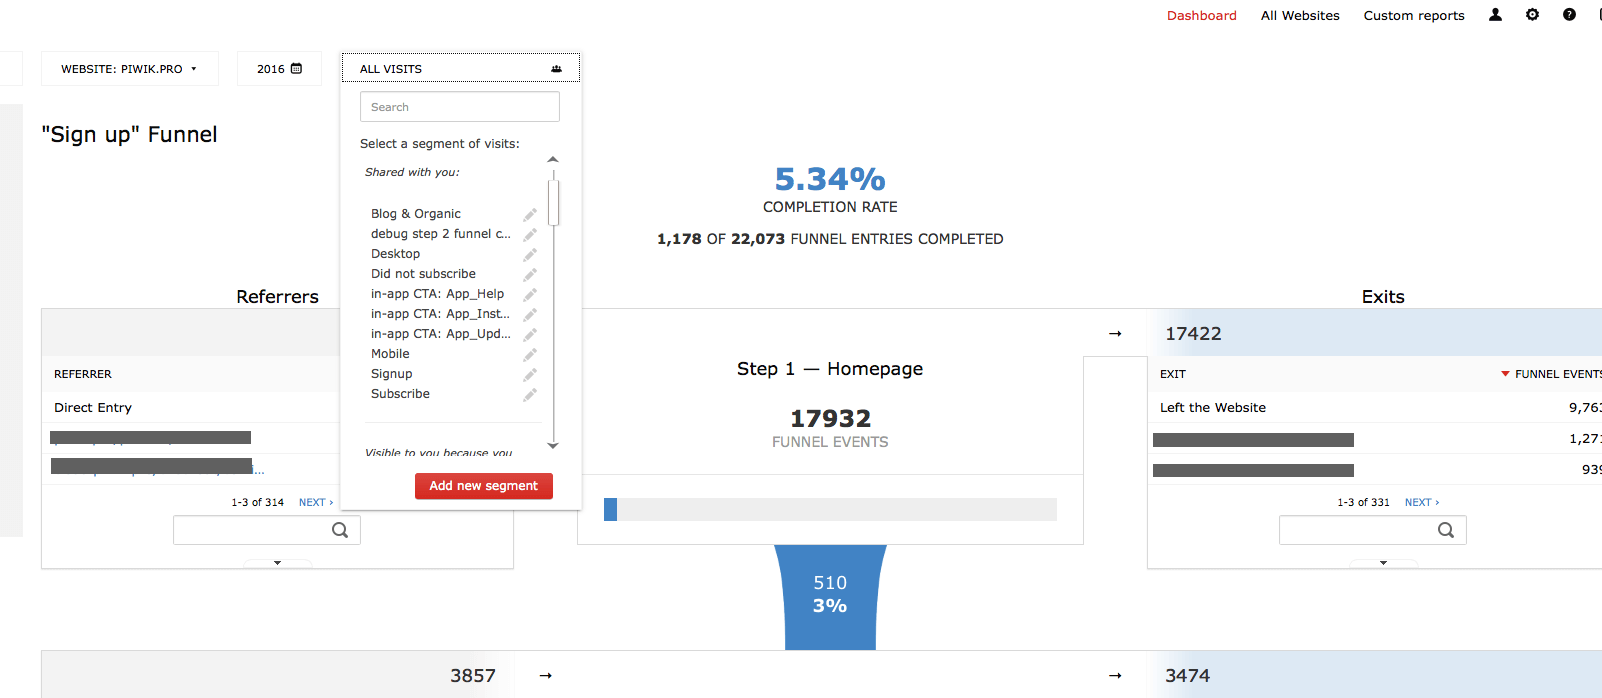
Now it’s time to start digging deeper and identify which segments of our visitors may be responsible for high drop-offs. Your funnel report by default presents data on all visits, but you can easily toggle between different subsets of your users, like we show you in the example below. If you’re new to segmentation, this post is a great starting point.
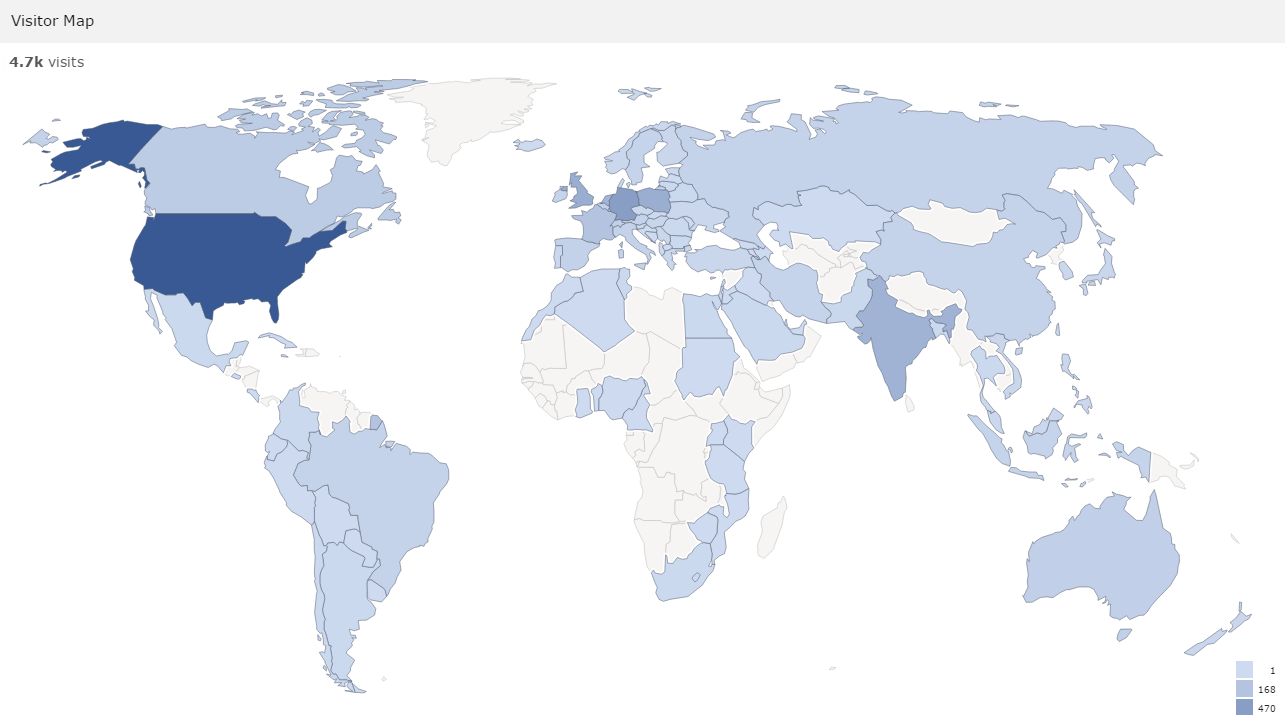
Check which of your segments are to blame for the high rate of exits. For instance, you could check if particular regions record higher numbers of drop-offs, or maybe it’s a matter of a particular device type that scores higher on the exit rate list?
Explore the following issues:
- Which visitor segments are responsible for the highest drop off rates in my funnel? What can I do about it?
- Is my sales funnel optimized for mobile visitors? Is it as user-friendly on mobile as on desktop devices?
- Is there any traffic source that is generating a high number of drop offs in my funnel? Should I reconsider my traffic acquisition strategy?
- Are there any regions or cities that have higher than average drop off rates? Should I exclude them from my campaigns?
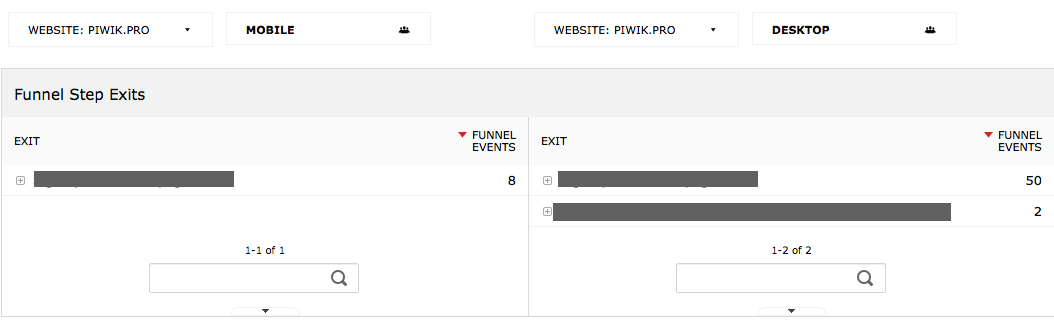
You can also use another premium functionality of Piwik PRO called comparison dashboard, which lets you easily view up to three segments side-by-side:
Step 3: Time for action!
Now that you’ve analysed your funnel, you should be able to understand which elements of your process can be improved to achieve more conversions. Depending on the nature of the problem, you could consider the following courses of action:
- Improve user experience for mobile visitors by optimizing your responsive design for funnel pages.
- Exclude problematic segments and audiences from your campaigns or significantly decrease the cost of acquisition for these groups.
- Create extra offers and push notifications for problematic segments of users, such as triggered pop-up windows with free shipping or a discount code bonus.
Conclusion:
Once you introduce the necessary changes, don’t forget to return and check their impact on your funnel performance. You may be surprised how much difference seemingly insignificant changes can make to your selling process.
And if you want to learn more about funnels, be sure to check out Funnel Analytics User Guide.
Optimize Piwik’s Performance Issues: A Free Guide
Learn how to boost Piwik’s reporting speed and strengthen web analytics data security: