
Product analytics is a crucial part of how organizations can improve their products, whether it’s an internal single-page application for employees or the next social media phenomenon. There’s no room for a product that is frustrating to use or doesn’t meet user’s expectations.
Using data-driven methods also adds credibility to your decisions when you present them to stakeholders. The trick is to know how to navigate analytics – in other words, how to pick and use the best metrics.
Product analytics is similar to web analytics but usually focuses more on engaging and retaining users who are using the product. Engagement and retention are key because they are often so low: 40-60% of people who register for a free product trial use it just once. Three days after downloading an app, 80% of new users drop it for good.
According to research by Shikhar Ghosh, a senior lecturer at Harvard Business School, digital products fail because their creators don’t focus on the right measurements, neglecting the metrics that most influence their success.
To make sure your digital product meets expectations, you need to define appropriate KPIs. The good news is, that there are multiple well-established approaches. Here are 42 ideas to set the right KPIs for your product and keep its users engaged and satisfied.
If you need a refresher on the basics of product analytics, read our article Product analytics 101: A beginner’s guide.
Get familiar with Pirate Metrics
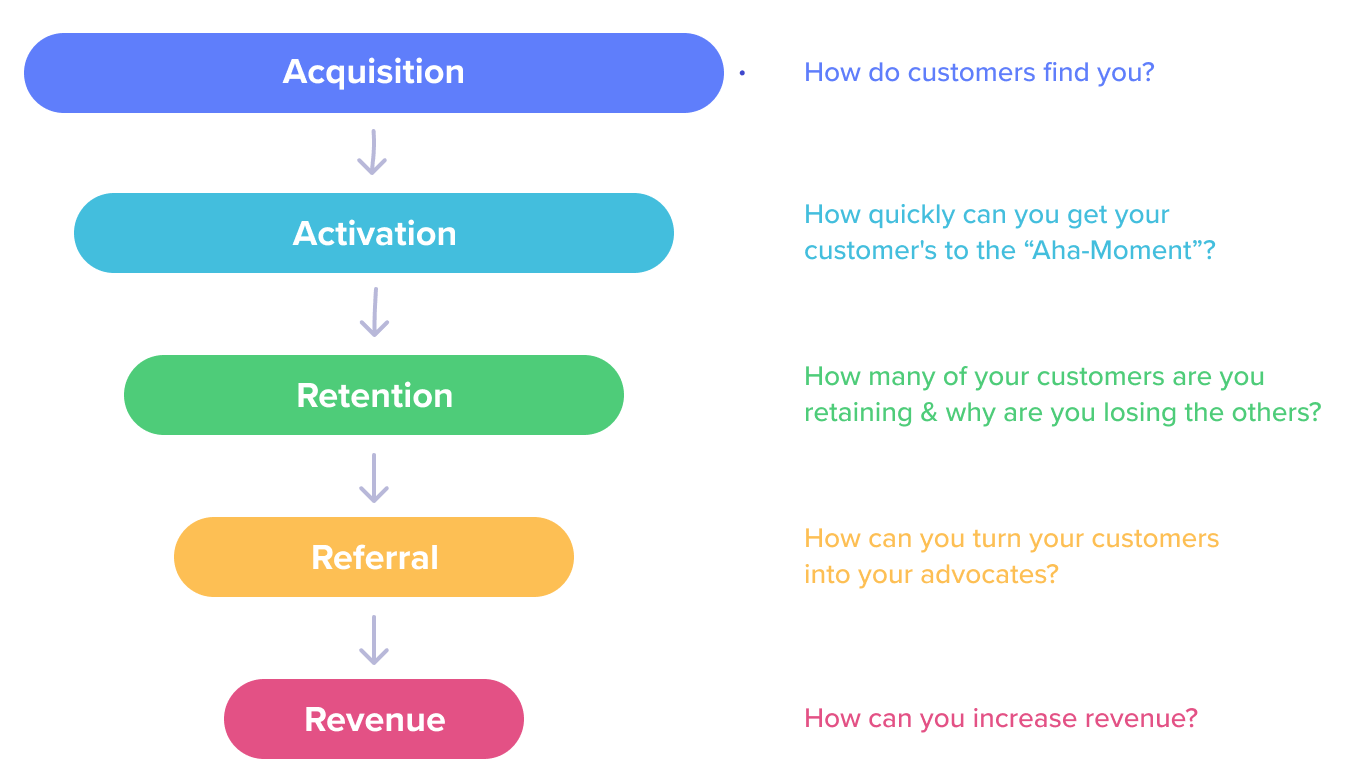
AARRR or Pirate Metrics is a framework designed by Dave McClure for startup growth, but is now widely used by a range of businesses and organizations.
It helps to better measure and then optimize steps in your marketing funnel by focusing on key metrics:
- Acquisition
- Activation
- Retention
- Referral
- Revenue
The core of this model is to determine your true business performance and emphasize the metrics that are important to your organization.
Acquisition
Let’s start with acquisition. First of all, your product needs users. Depending on the business you operate in, objectives vary from company to company.
For instance, if you offer a SaaS product, you want users to sign up for a free trial. But you might also have the goal of making your product known to new users and converting them into paying customers.
The starting point is to understand how people first encounter your product. Having achieved this, you can optimize the right channels to bring more users to your app.
These are the KPIs you should track:
- Number of New Users (could be measured daily, weekly, monthly)
- % User Base Growth (could be measured daily, weekly, monthly)
- New Users as a % of your Total User Base
Looking for an analytics platform to gather and act on data from your digital product? Read our comparison of several platforms to see which would fit you best.
Activation
Having someone request a trial is just the beginning since they might not even use the product. Various organizations understand activation in different ways.
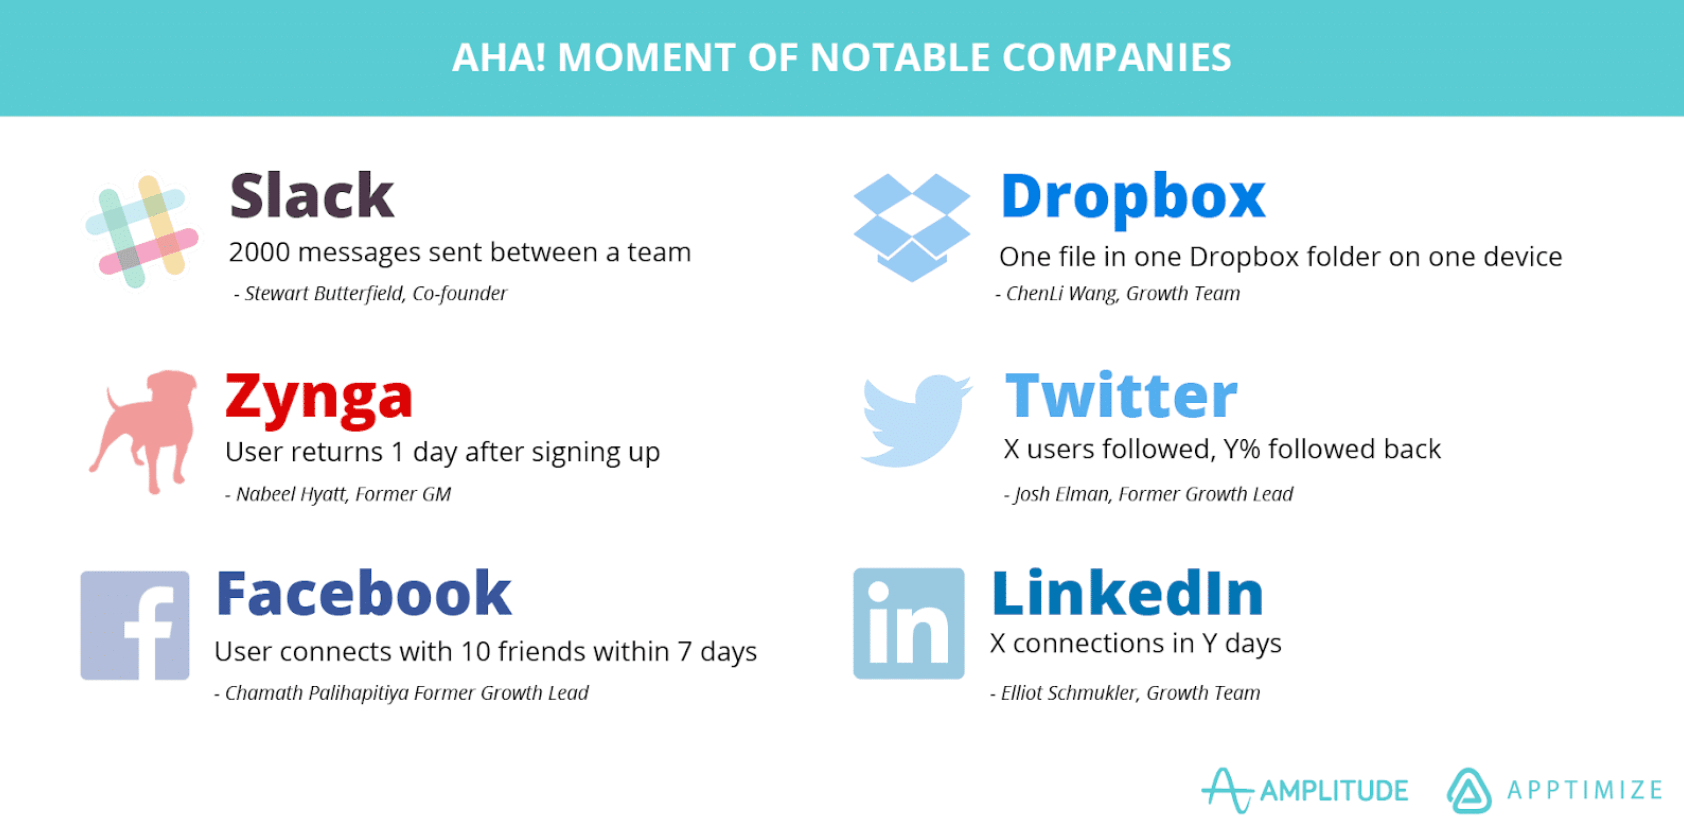
For example, Airbnb understands it as completing a booking, while for Facebook it’s connecting with a friend. But for most companies, it would be the “AHA” Moment, when users discover the value your app offers. They grasp how your product can help them.
The “AHA” Moment, or critical event, is extremely important: it’s “an action that users take within your product that aligns closely with your core value proposition”. It’s most likely that after this moment, someone will continue using your product. That’s why recognizing the event is vital to your business’s retention strategy as it sets the direction for your product development.
pro tip
The so called “AHA” Moment is the result of several steps and actions a user takes. That’s why the path to identifying your users “AHA” Moment requires:
- tracking every single action
- segmenting your users
- giving your analytics time to do the work and collect data
In terms of KPIs, you should measure:
- Number of Times a User Logs In/Completes Set Up
- New Trial Sign-Ups (SaaS)
- Freemium Customers (SaaS)
Retention
Once you have people activated, the natural next step for the success of your product would be to keep them using it – in other words, retention. This metric is probably the most vital sign you’ve got in a quality app.
You need to make sure people are coming back to use your product. If they are, then you’re doing a great job delivering value. Verify this by tracking key retention KPIs like:
- % Customers Who Use Your Product/Feature On and On
- Customer Retention Rate
- Customer Churn Rate
- New vs Current User Retention
Low retention means something in your product needs fixing. What’s more, you can improve it by reminding people of new relevant features, or by making sure an account manager stays in touch with customers and advises them on further usage.
Referral
Referrals are one of the most powerful ways of fuelling an organization’s growth. As revealed by Nielsen Global Trust, 83% of online respondents follow the recommendations of friends and family when shopping. Trusted individuals who emphasize the good qualities of your product are great advocates for your company.
The most common KPIs for measuring the probability of customers recommending your product to their peers are:
- Net Promoter Score, NPS (on a scale of 0-10, 0 is ‘not at all likely’, 10 is ‘extremely likely’)
- Advocacy Rate
Revenue
When people know and use your product regularly, they recognize its value and eventually pay for it. The formula for lifting your revenue is to get more value from your customers than it costs to obtain them. That’s why you should focus on the LTV:CAC ratio.
Lifetime Value, also called Customer Lifetime Value, is the total worth of your customer to your organization over the whole period of using your product. Customer Acquisition Cost (CAC) is everything you spend on your initiatives to obtain a customer. The recommended LTV:CAC ratio is at least 3:1 to achieve stable growth.
If you want to know more about CLV and how to calculate it, check out this post: Customer lifetime value: what is it and why is it important for your business
Here’s a recap of Pirate Metrics:
Improve user experience in your digital product with the HEART framework
The user experience and satisfaction people take from your product should be given pride of place in your strategy. Fortunately, you can take advantage of the HEART framework designed by one of Google’s research teams. It’s applicable at numerous levels, from the whole app or product to a single feature.
The framework guides what to measure to make better product decisions. To enhance your app’s UX, you should track the following user-centric metrics:
- Happiness – measures attitudes or satisfaction, can be collected via surveys
- Engagement – user involvement
- Adoption – new people using your product or feature
- Retention – users who stick with your product
- Task Success – covers behavioral metrics of UX e.g. effectiveness, efficiency, error rate
| HEART Framework | Metrics |
|---|---|
| Happiness qualitative user experience measurment | App Store rating Ease of use NPS |
| Engagement frequency, intensity, depth ofinteraction, or level of involvement in a given timeperiod | Number of videos watched per user in a week Number of uploads Number of shares |
| Adoption a number of new users a product or an updated feature gets over certain timeperiod | Upgrades to the latest versions New subscriptions Purchase by new users |
| Retention how many users stick around and how many start to churn | Number of active users Renewal rate Repeat purchase |
| Task Success efficiency, effectiveness and errorrate | Search result success Time to upload Profile creation completion |
Source: Google Ventures
Bear in mind that this is just one of numerous prioritization models. It should be treated as a set of guidelines that you can easily adjust, not a rigid formula to blindly follow. So, choose only those product analytics metrics and KPIs that align with the goals of your particular product or strategy.
Track metrics that are crucial for your product team
When it comes to product development teams, they should also put certain product analytics metrics in the spotlight. Follow the advice of Tim Platt, a product manager at American Express: “Don’t ship anything until you’ve identified the metrics that matter (…). Make metrics part of your definition of ready.” With this approach, you can ensure that your product is complete and your team executes with the highest effectiveness.
The starting point of your strategy could be Pirate Metrics. Yet, it might not be a perfect fit for your development team’s goals. So, besides the issues of acquisition and retention that we’ve already covered, it’s crucial to measure if your product meets users’ expectations. A great indicator would be engagement.
This metric is vital for your business and helps you understand how people use your product, how often, what features are used the most, and for how long. Also, identifying the profiles of people who use a certain feature could bring valuable information.
Here are KPIs you should track for product engagement:
- Number of Active Users
- Net Promoter Score
- Active Users as a % of Your Total User Base
- Product/Feature/Channel Usage
- Number of Key User Actions Per Session*
- Number of Logging into Accounts
- % of Users/Sessions Where the Number of Steps/Clicks Exceed the Optimal Number
*Depending on your product, the definition of action would vary. It could be uploading a photo, watching a video, making a transfer, etc.
Moreover, you can add another dimension to understanding engagement, what’s called stickiness. It measures how often people use your product within a given time frame. For instance, how many days someone was active in a certain period, or did a particular event, could be a critical measure.
You can also use this metric for measuring retention as it tells you how many times people come back to your app. You can track stickiness on a daily, weekly, or monthly basis depending on the product’s usage interval, and the frequency with which you expect people will use your app.
What may greatly differentiate products and then impact your analysis of retention is the product’s usage interval. Certain products are designed for daily usage: social networking apps, media, games, and productivity apps. Others, like those for ordering food delivery, transportation, booking, expense reporting, etc. are not used so often.
So if you want accurate reports on retention you need to know the expected frequency of your product’s usage, and on that basis conduct your analysis. In this way, you can steer clear of misinterpretation of your data.
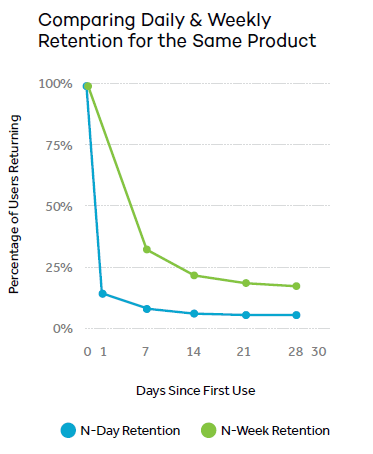
As you can see, when you juxtapose daily retention with weekly retention you get a much wider perspective on product usage that helps you measure your app’s performance and align your strategy.
Create frictionless product funnels with PQLs
For many years, companies – not only SaaS – have been using the same sales funnel focused on SQLs and MQLs. But recently this model has transformed. Now, a range of businesses is shifting their strategies toward a product-led approach, which results in the emergence of Product Qualified Leads (PQLs).
PQLs define your potential customers. These are people who have tried the product, through free trials and freemium models, and take actions that strongly indicate they will become paying customers. By tracking users’ in-product behavior you can better assess when they are ready to finalize a purchase.
A product-led model transforms how organizations measure the effectiveness of customers going through lifecycle stages:
Sign-up -> PQL
PQL -> Customer
Customer -> Active customer
If you adopt this approach, then the most important KPIs to track are:
- (Number of) Product Qualified Leads
- Signup-to-PQL Rate: tells how effectively your organization engages prospects in the early stages of reaching initial value
- PQL to Customer Rate: shows how well your organization converts PQLs to customers
COMPARISON
The comparison of 10 web and app analytics platforms
Learn the key differences between Piwik PRO Enterprise, Google Analytics 4, Matomo Cloud, Adobe Analytics, AT Internet, Countly Enterprise, Mixpanel Enterprise, Amplitude Enterprise, Snowplow Enterprise, and Heap Premier.
Follow the Retention Lifecycle framework to keep users around longer
You already know that keeping your customers happy pays off, as it costs less than acquiring new ones and boosts your revenue. This led the experts from Amplitude to design the Retention Lifecycle Framework to help organizations engage their customers more and make them stick with their brand.
You need to adjust your retention strategy according to the different stages of users’ product journey. If you want to improve retention, you should pay attention to KPIs like:
- New user retention – use your product for the first time
- Current user retention – once active users who are now idle
- Resurrected user retention – people who used to be regularly active, became idle and now use your product again
By learning what specific users do in your app you can better understand if they are receiving the value you promised from your product. That’s also a great opportunity for you to learn how they use your product. Such behavioral data provides valuable insights on whether they flow with in-product usage or get stuck along the way.
Once you take a closer look at users at different retention stages, you can improve your strategy, engage inactive customers, and inspire all users to become more active.
The idea behind the Retention Lifecycle Framework is to make new and resurrected users follow in the footsteps of the current ones. Your current users, those who regularly take advantage of your product, will be key players propelling your organization’s growth and lifting revenue.
Product analytics and data-driven organizations
Despite what some might say, data isn’t everything in product development. Sam Tardif, product manager at Atlassian, notes that “[…] it’s great to be data-informed, but being entirely data-driven can sometimes leave you blind to the overall experience that you’re creating for users.” Thus don’t forget to ask your users what they think as well. A good mix of qualitative and quantitative data tends to give the best results.
We hope that some of these KPIs will help you make the right decisions to improve your product. If you want to dive deeper into how best to collect and use data, read some of our other articles on the topic: