Regular, run-of-the-mill funnel reports are a quick way of finding the low-hanging fruits of conversion optimization.
With these reports you can easily spot ill-performing first touchpoints and track the efficiency of your page content.
Unfortunately, at the same time they’ll often provide you with a very fragmented and incomplete overview of the customer journey.
Usually, funnel reports are capable of capturing only the last few steps before visitors turn into paying customers. However, there’s one powerful but little-known technique of constructing funnels around the whole audience of your website – not only the individuals reaching the transactional pages of the shopping cart.
We call it “funnels based on behavioral segments.”
Free Comparison of 4 Leading Customer Journey Analytics Platforms
Compare 21 features between Woopra, Adobe Marketing Cloud, Google Analytics and Piwik PRO and find the best match for your business.
What do we mean by behavioral segments?
Behavioral segments are segments allowing you to place your website visitors in different buckets based on their on-site behavior. Each bucket and each set of behaviors represent different stages of the customer journey and different funnel steps.
Needless to say, those segments can vary from business to business. Here are some example behavioral segments for the e-commerce customer journey:
1) All users on your website with at least one interaction – which usually means users who didn’t bounce off after entering your website but stayed for a while to consume your content or offer.
2) All users on your website with interest – means users who not only didn’t bounce off your website but also showed some interest in your offer. For example, they visited some key subpages, like product or service pages.
3) All users on your website with clear intent to buy – means users who demonstrated the intention of doing business with you. It could be:
- all users who added a product to a shopping cart
- all users who reached a contact page with a lead capture form
- all users who reached a pricing page.
4) All users on your website that succeed in buying – simply means all the users who have converted and became your first-time customers.
5) All users on your website that return with intent to buy more (a.k.a loyal users) – means all the users who have previously become first-time buyers and are now coming back to your website and either showing clear intent to buy from you or have already converted for the second time.
How to set up behavioral segments in your analytics
Here is a sample analytics set-up for behavioral segments on an e-commerce website:
All users on your website with at least some interaction
A simple segment that creates bucket for users who performed more than one action. Basically, it means they didn’t bounce off the page immediately after arriving.
All users on your website with interest
This behavioral segment is built on top of the previous segment. Apart from the “minimum number of actions” condition you also need to add one more condition – a user must have visited one of the product pages during their journey.
All users on your website with intent to buy
A simple segment of all the users who reach the shopping cart during their journey, meaning they had strong intent to buy something but did not necessarily end up buying anything.
All users on your website that succeeded in converting to a paying customer
Another very simple behavioral segment bucketing all the users who have converted and became paying customers.
All users on your website that became second-time buyers
The last segment filters out users with at least two purchases on their account.
Psst! Not sure how to go about segmenting your data? Then you should definitely get familiar with this helpful user guide.
Now you’ve mapped all the funnel steps and customer journey steps into behavioral segments. Time to make this data actionable and start collecting some valuable insights.
Good data visualization – this is where the magic happens
The next thing you need to do is to actually visualize the user flows and drop-offs between each step in the customer journey so you can identify bottlenecks. But how are you going to get this data if you only have raw segments with no relation to one another?
First, you need to find out how many visitors you’ve bucketed in each segment. For this purpose you’ll build the following custom report:
Website visitors segmented by device type (desktop, mobile or tablet)
Psst! Here you can find some additional reading on creating segments in Custom Reports.
After you implement this report, you could make use of the behavioral segments that you’ve previously created. What you need to do is to apply one segment after another and see how many desktop and mobile users you have in each of the following segments:
- Users with interaction
- Users with interest
- Users with intent to buy
- Successful users
- Loyal users
The report will tell you precisely how many users ended up in the “users with interaction” segment in the analyzed period. In this particular example, that will be:
- 21,062 users with interaction using desktop devices and
- 14,837 users with interaction using mobile devices
At this point, you’ve gathered some data, but still not enough to act on it just yet. Fortunately, there’s a way to change that.
How to visualize your behavioral funnel
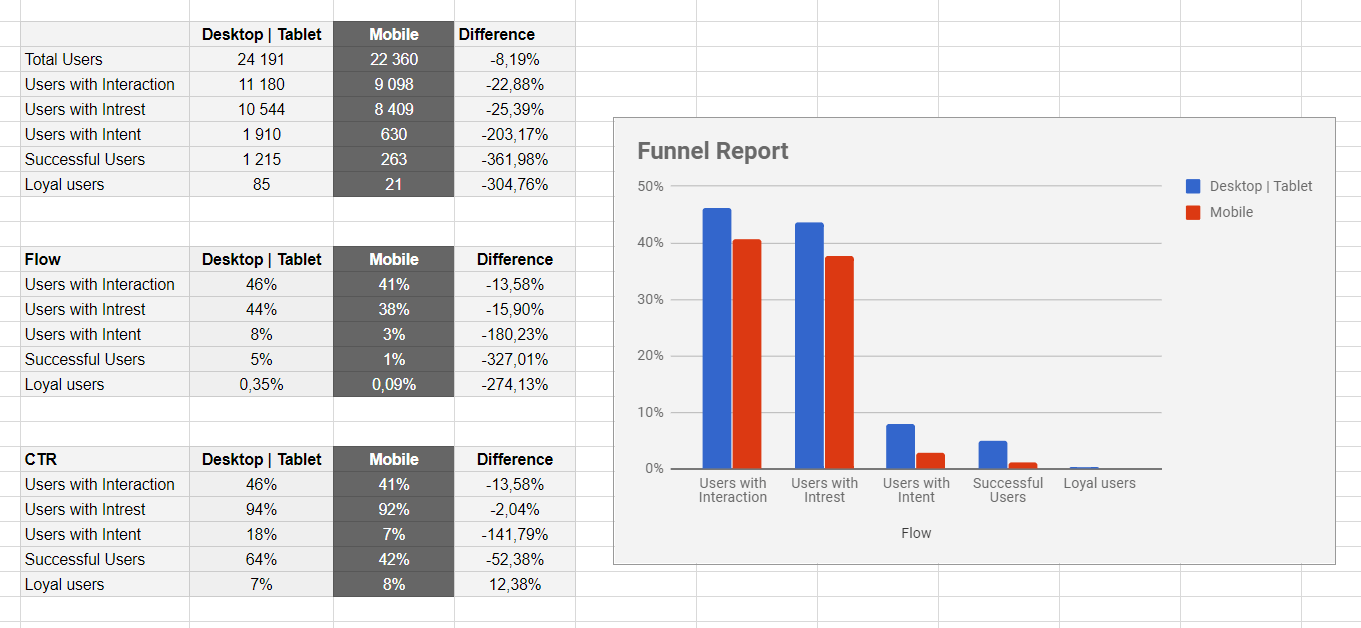
Now it’s time for a big jump forward. You’ll apply all the remaining segments to this report and export the data to an external spreadsheet. You should be able to generate a view similar to this:
It seems like a lot of exporting, copy, pasting and implementing formulas, but in fact it’s really not. And even if it requires some extra work, it’s definitely worth the input because of the quality insights you’ll gain from it.
This is more or less how you approach this step:
- Open an empty spreadsheet and create 3 tables.
- In the first table, simply copy and paste the number of visitors/users you have in each behavioral segment and segment this data in columns by device type.
- The rows in each table mirror the behavioral segments you have created previously, but at the same time they represent steps in the behavioral funnel. So, “Users with Interaction” represent the first step in the funnel, “Successful Users” represent the last step in the funnel, and “Loyal Users” represent user retention, a bonus step in the funnel.
- Columns represent additional segments that you use to really drill down into funnel performance. In this case you use “Mobile” and “Desktop” as additional layer of segmentation.
- The third column in each table is where you look for insights. It helps you make your data more actionable.
What you’ll find in the tables
The first table simply highlights the difference between mobile and desktop users at each stage of the behavioral funnel.
The second table is far more actionable because it uses percent values to provide you with funnel flow data. It doesn’t only tell you how many users you’re losing between funnel steps. It also helps you understand which segment (desktop vs mobile) runs smoothly and which is causing funnel drop offs.
The third table is a useful variation of the second one and provides click-through rates (CTR) for individual steps of the behavioral funnel. It’s very helpful for learning which funnel steps are the most and the least successful
The bar chart is your cherry on top. It helps you visualize and better understand the data in the tables.
Three most important insights provided by behavioral segmentation
What you can learn from this example? What insights can you achieve from behavioral funnel analysis? It’s time for some conclusions that deliver concise answers to these fundamental questions.
1) Because of the high bounce rate, you lose almost 60% of all users even before they enter the funnel. This is definitely an indication that your website or app is making a very bad impression on users and needs some significant improvements.
2) The biggest drop off in the funnel happens between the “Users with Interest” and “Users with Intent” stages. The drop-off at this steps is significantly higher on mobile than on desktop (18% click through for desktop users vs only 7% for the mobile ones).
This indicates that you need to dig deeper and uncover the reasons why so few users click through between product pages and the shopping cart. In particular, what you need to investigate is whether the experience on product pages is positive for mobile users.
3) Another huge drop-off occurs between the “Users with Intent” and “Successful Uses” funnel steps. There is only a 64% click-through rate between those steps for desktop users and 42% for mobile users. This means you need to investigate further what the reasons might be behind so many users abandoning their shopping cart.
Free Comparison of 5 Leading Web Analytics Vendors
Compare 40 Variables of 5 Leading Enterprise-Ready Web Analytics Vendors:
Summing up…
Behavioral funnel analysis is an extremely useful alternative to regular funnels. Their advantage is that they take into account the full customer journey and allow you to track your funnels from the very first interaction users have with your website, landing page or app. This in turn gives you a broader perspective on your audience and the way they move through different stages of their journey.
If you’re looking for guidance on applying behavioral segments to your funnels or simply want to learn more about the process, feel free to contact us any time. Our team will be happy to help!