
Imagine a visitor comes to your site because your marketing campaign has intrigued them. Then imagine they bounce off because the landing page image is too big to read on their iPhone.
Or they leave because the headline is from another campaign – a copy and paste error! It can happen even at the best sites, but it has fatal consequences as visitors leave immediately and may not come back.
The key is to eliminate such usability issues. And this should come before you try to fix anything else. As noted by Peep Laja from ConversionXL,
Bugs – if they’re around – are your main conversion killer. You think your site works perfectly – both in terms of user experience and functionality – with every browser and device? Probably not.
You just need to make sure your site is user-friendly at first sight. Easier said than done. But actually it’s pretty simple if you take a little help from analytics.
That’s why we want to present a couple of analytics reports that you should include in your arsenal. We’ll show you how to set them up and use them right, so that your customers go smoothly though your site and come back again and again.
You need strong pillars to support your technical analysis. Cross-Device, Cross-Browser and Page Speed Reports are exactly these pillars. They’ll help you quickly find the stumbling blocks new visitors encounter.
Once discovered, you can fix them on the spot and let users glide through your sites and reach their final destination.
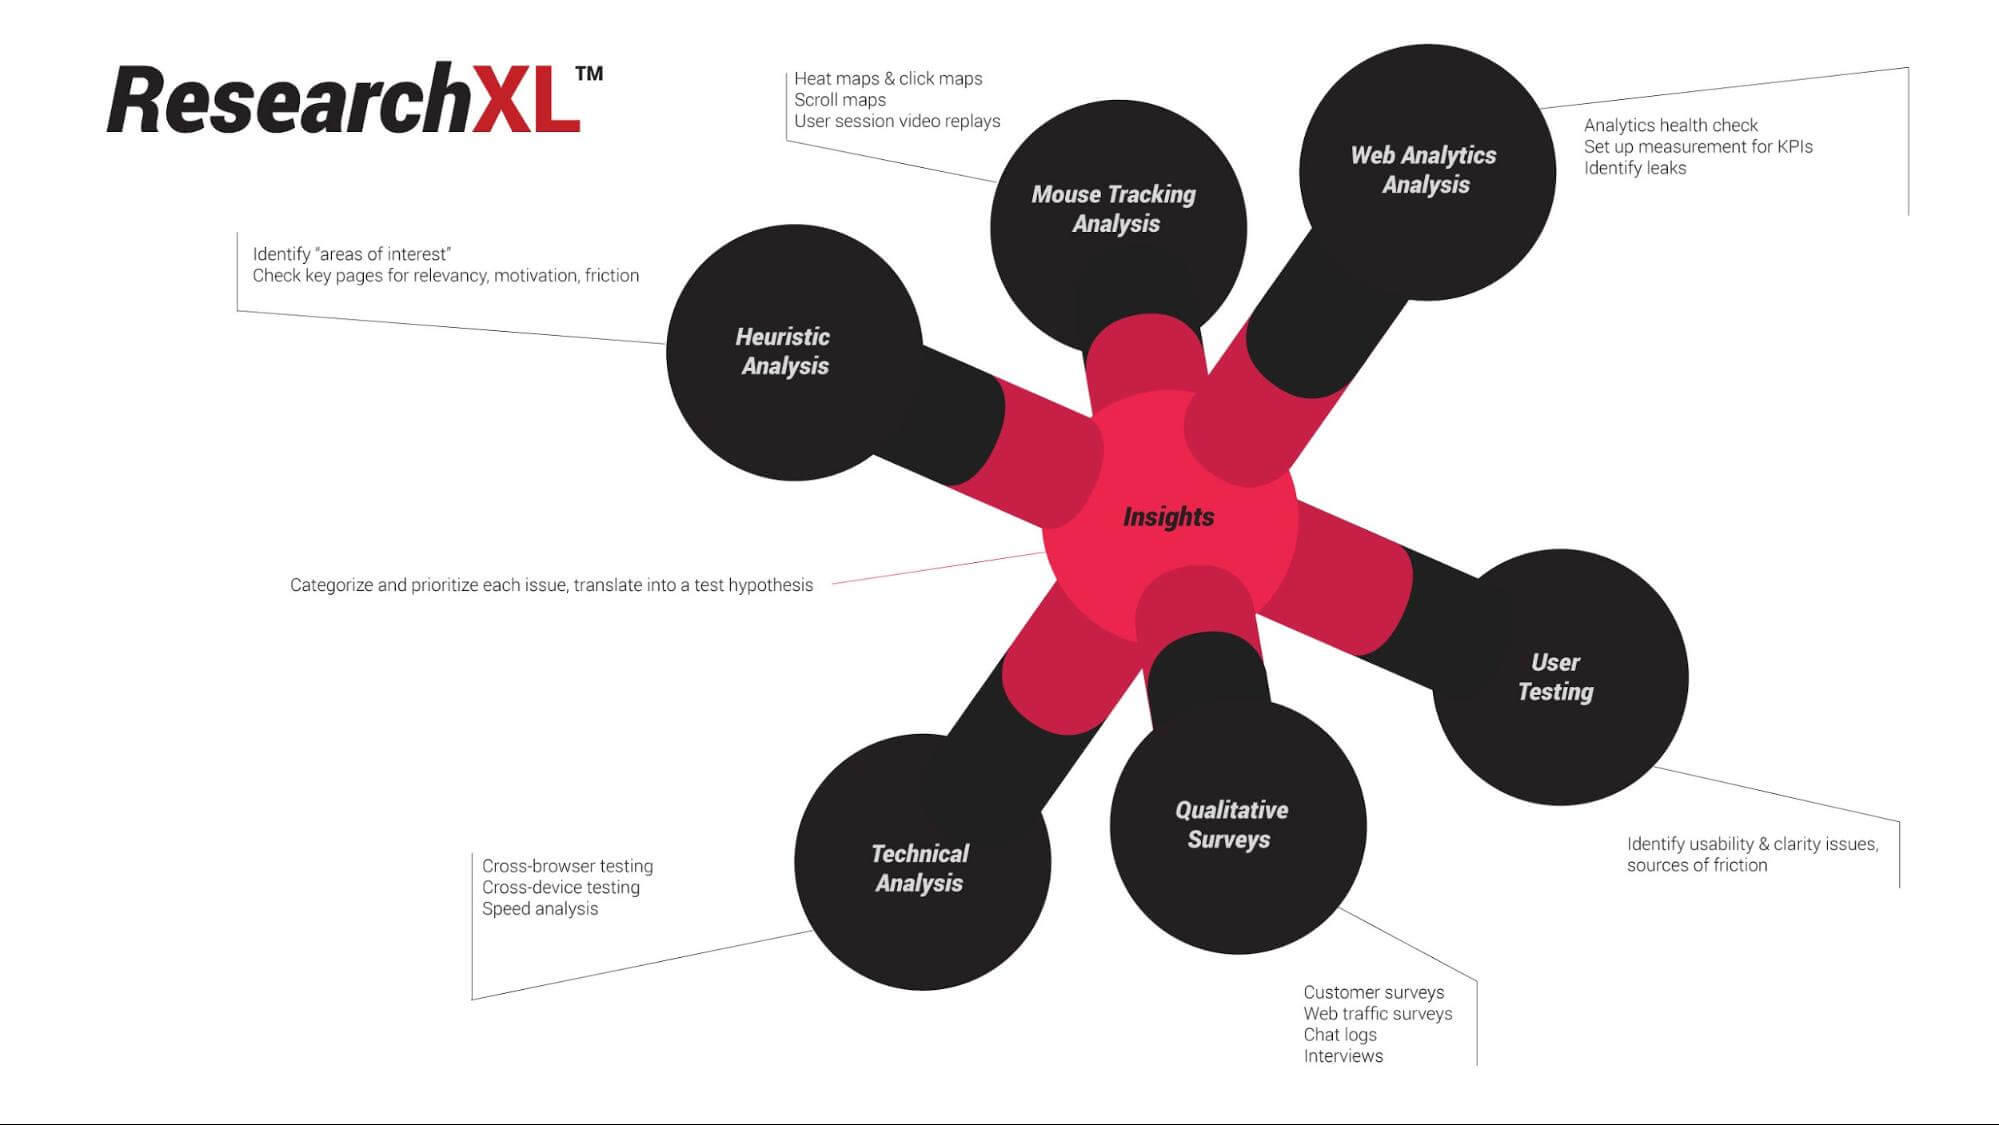
We’ve prepared this use case with a strong focus on Technical Analysis. It’s a crucial part of the ResearchXL model, a powerful conversion research framework that let analysts and marketers set the right direction for conversion optimization.
A little background on running analytics reports
Before we dive into the details, there’s one thing to keep in mind. Analytics reports tell us where the problem is, but they rarely explain why the problem happens. The same rule applies to this particular report. It tells us which landing or entry pages are making a bad first impression and are causing users to bounce off.
Free Comparison of 5 Leading Web Analytics Vendors
Compare 40 Variables of 5 Leading Enterprise-Ready Web Analytics Vendors:
So, you get a little hint about why it may be happening, but not the full answer. The First impression report helps you figure out:
- whether your landing page is user-friendly on mobile/desktop
- whether there are certain browsers causing your landing page to break
In a nutshell, such analysis lets you eliminate usability and functional issues that prompt the user to bounce off your page. These can be all kinds of issue, like a menu that doesn’t work or pages that take too long to load.
The report may also reveal that people bounce off your site because it breaks on iPhone 7 with iOS 11.2. That’s an easy fix for your developers and a low-hanging fruit of conversion optimization.

Apply the cross-device report to check if a device causes conversion troubles
Enough theory.
Now it’s time to put all this information into action. We’ll guide you through the whole setup of each report to make sure you have things right from the beginning. Here we go!
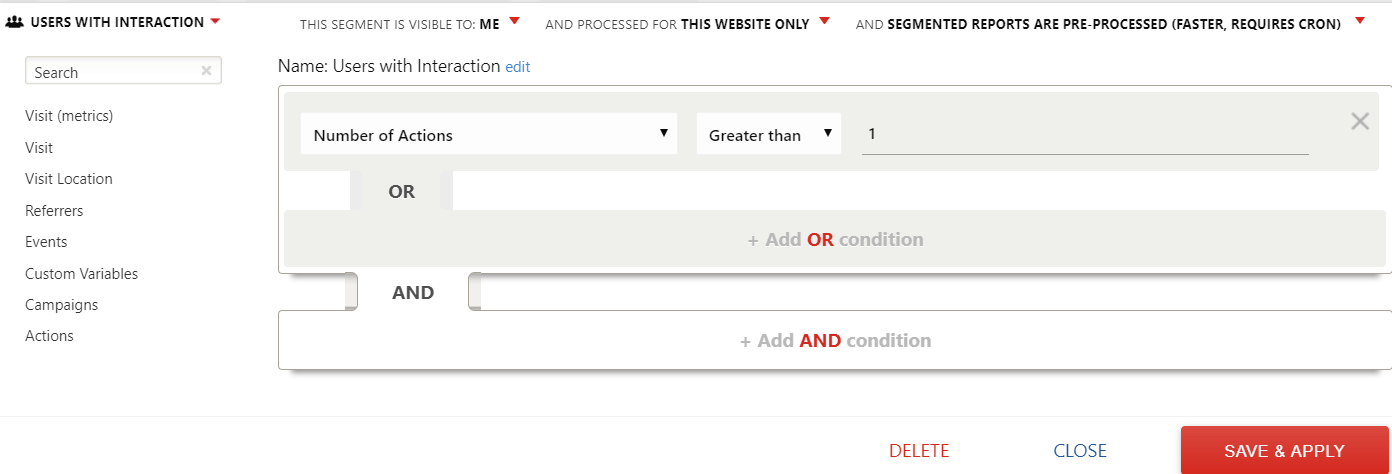
Step 1. Pick the right metrics
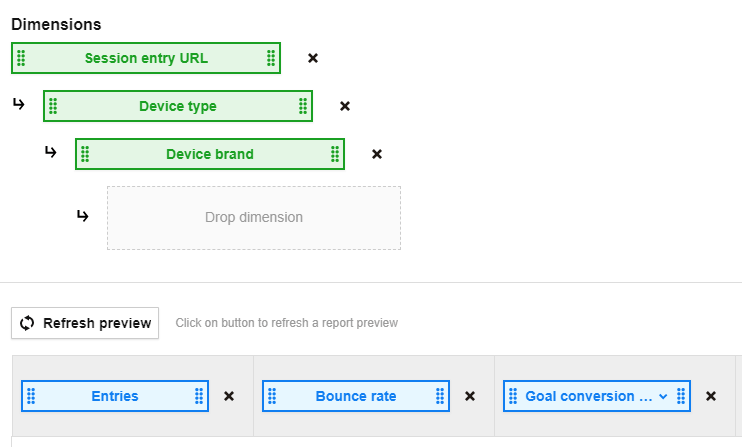
First, you need to select the right metrics from the list and put them on a drag & drop placeholder. You should select:
- Entries
- Bounce rate
- Goal Conversion Rate*
*Of note, Goal Conversion Rate is applicable when conversion goals are already being tracked.
Step 2. Set the proper dimensions
Now it’s time to choose from the following dimensions:
- Session entry URL
- Device type
- Device brand
Then, one by one, drag and drop them to the dedicated placeholder. Here’s what you should end up with:
Step 3. Looking for high bounce rate red flags
Once you set up the report it’s time for analysis. But before we move on, click the label in the Entries column and sort all the landing pages from the ones receiving the most traffic to the ones that are the least visited.
What you should be looking for are landing or entry URLs with extraordinarily high Bounce rate . Namely, rates that exceed the average bounce rate for the whole website and with conversion rates below the average value for the whole website.
Now, let’s see what our setup reveals:
Just a glance is enough to see a red flag. Although it’s only the first screen of the report, one specific landing page is already screaming out for a closer look.
Free Comparison of 5 Leading Web Analytics Vendors
Compare 40 Variables of 5 Leading Enterprise-Ready Web Analytics Vendors:
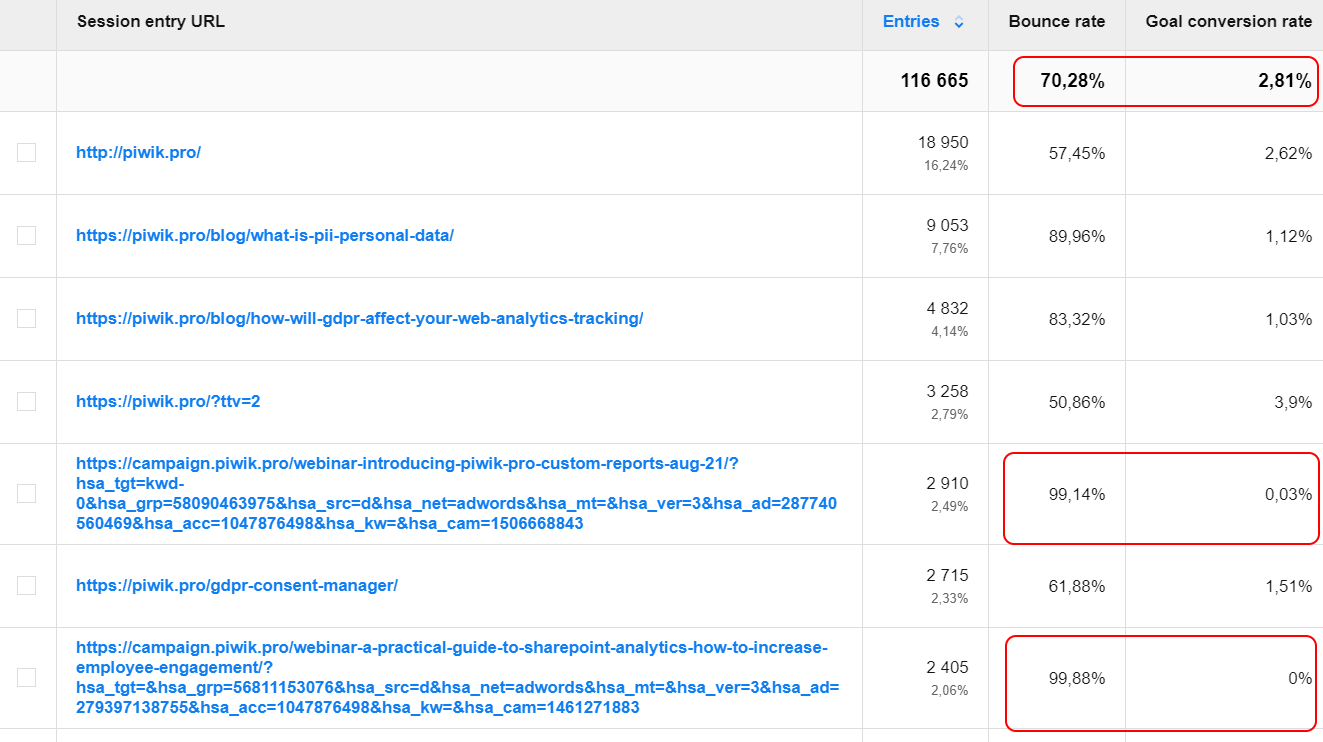
It grabs our attention for three reasons:
- It collects a significant amount of traffic. In other words, it’s a very popular entry point for the piwik.pro website
- The landing page has a significantly lower conversion rate than the website average. The average conversion rate for this URL is 0.03% whereas for the website overall it’s 2.81%.
- The bounce rate for the analyzed URL is 99.14%. This is almost 30% higher than the website’s average.
That’s how you can find where the conversion problem is on your website. So now we’ll try to figure out why it happens and see if there is an easy fix to lower bounce rates and lift conversion rates.
Step 4. Can we blame the device type for conversion issues?
It’s time to dig a bit deeper and figure out if it’s device type causing such a high bounce rate and low conversion rate.
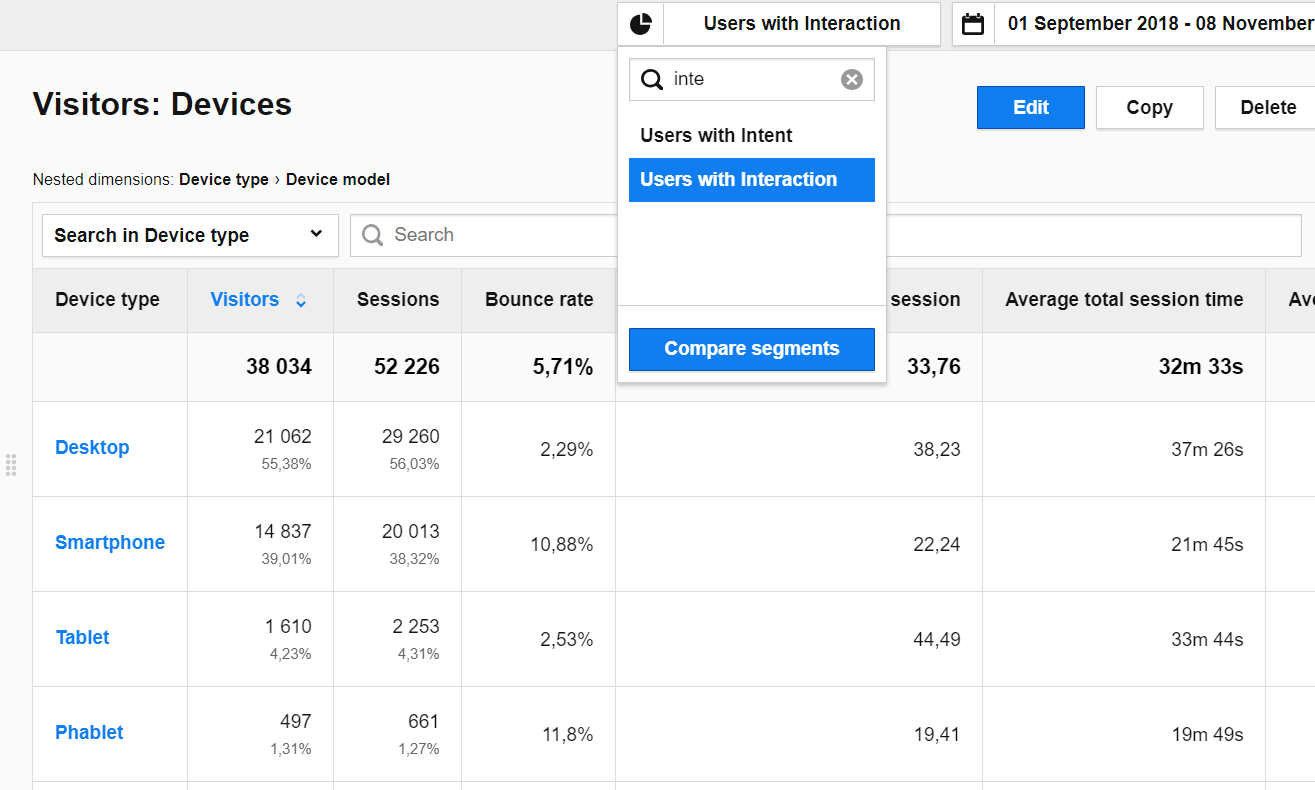
Have a look at the lower level of our report. Here’s the traffic to this particular landing page, broken down by the type of device visitors browsed the page on. As you narrow down your traffic and create granular segments you’ll be able to better focus on finding the precise cause of your site’s issues.
Note: Every time you go deeper into your report it means you’re segmenting your traffic. You can do it according to your preferences and the particular purpose(s) of reporting. In this way you get more detailed views on the situation you want to analyze.
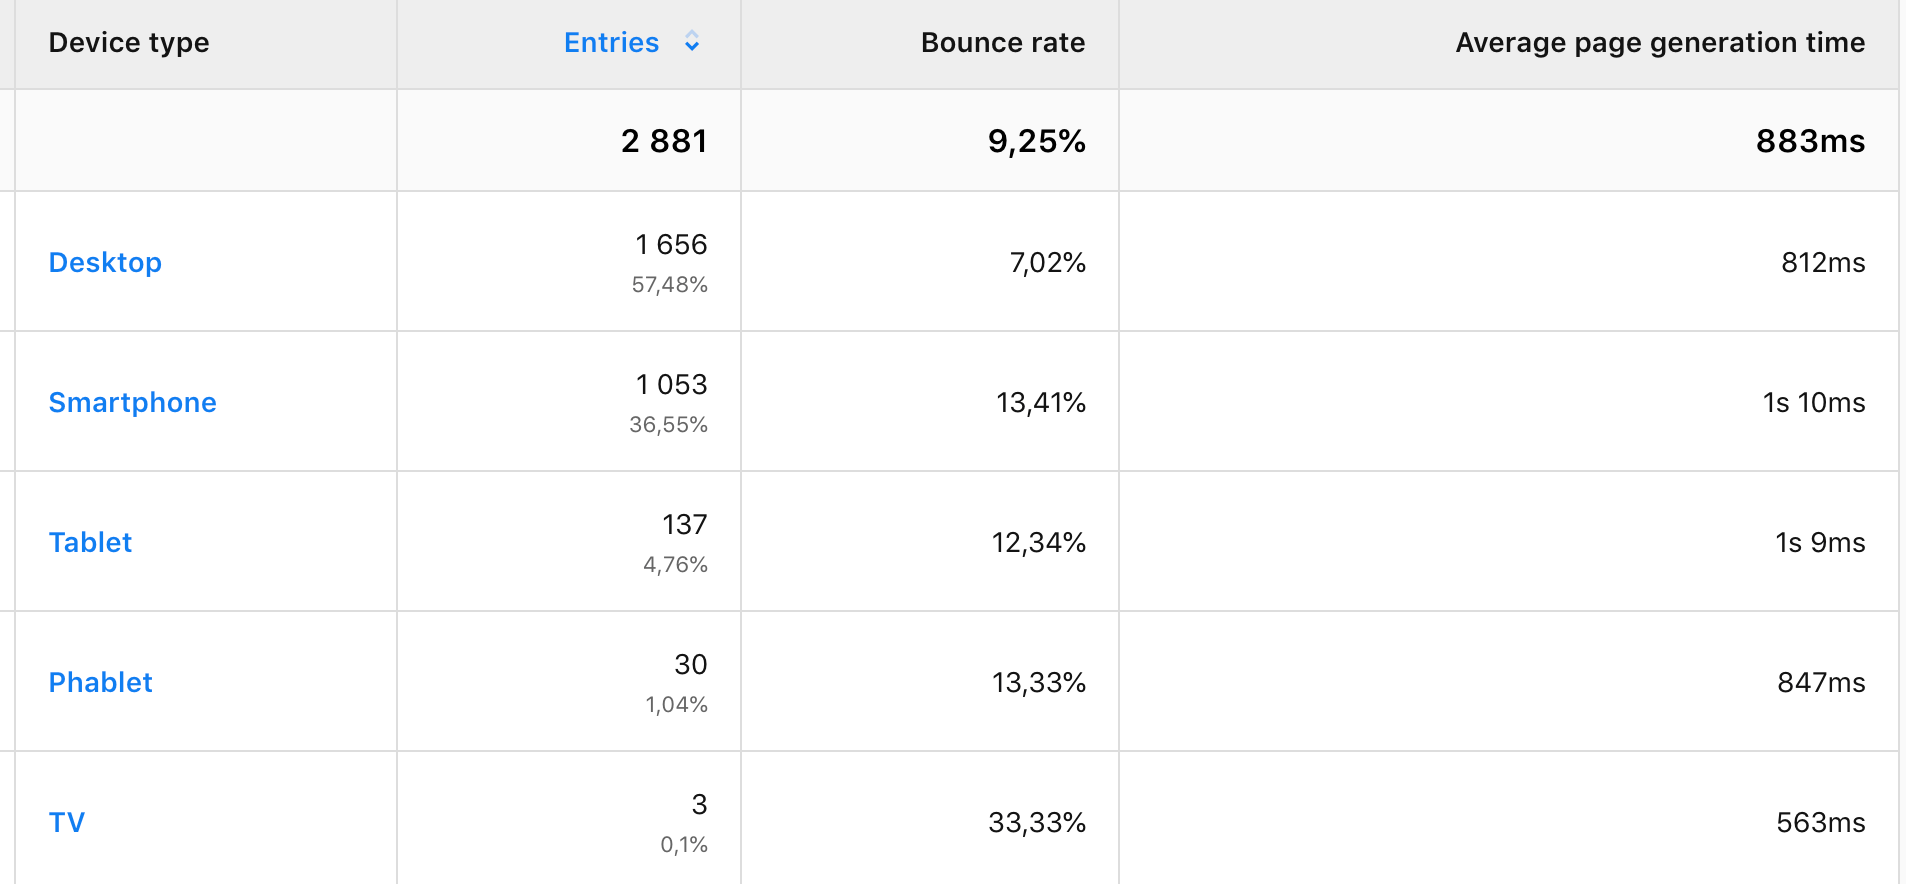
Now you need to find red flags based on the average bounce rate. That’s why we analyze what device people used while visiting our URL.
It turned out that the majority of users visit this page via smartphones. And the bounce rate for mobile devices, which is about 75%, is much higher than for desktop devices, which is roughly 56%.
So we’ve got some clues, but still we can’t clearly state that user experience is broken because the landing page is not suitable for mobiles. In this case, performing some cross-device testing would be a good step. But for now, let’s move on with some other reports to get more answers.
Step 5. Can we put the blame on device brand for causing conversion problems?
Ok, once you know which device is causing your major bounce rate, you should drill down further and divide up devices by brands. By narrowing your traffic and precisely segmenting it, you create meaningful chunks that you can carefully analyze.
The principle of cross-device testing is that you need to look at one device category at a time. Use device segments: desktop, mobile, tablet, etc.. Viewing each device in isolation generates clear results and devices won’t get lost in averages.
So, have a look at the report after you’ve applied segmentation.
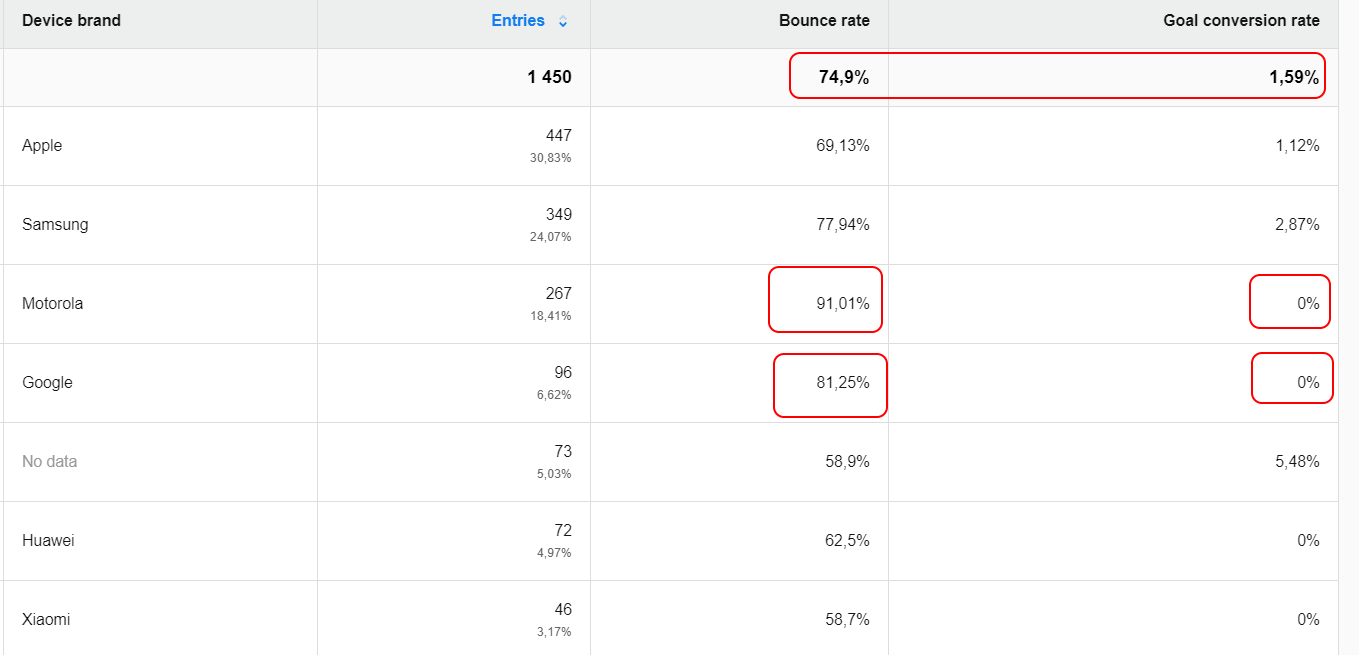
First of all, the majority of users browse the page on Apple devices. Just a glimpse at the report shows us that the dubious honor of first place, with a bounce rate of 91.01%, belongs to Motorola with a 0% conversion rate.
When comparing to the average 74.9% bounce rate, we realize that we still don’t have an answer and we need to move on with our analysis.
So what now? Discovering an underperforming site is great for further CRO research. Some issues with high bounce rates can have their roots in cross-device issues. The user experience might be broken on some pages in the case of users who browse them on Motorola or Google phones.
Cross-device issues only provide clues. Your job is to look deeper to find out where you have those problems and why they happen. For instance, you can take advantage of tools like crossbrowsertesting.com and browserstack.com to check where the problem lies. To complete the whole process and validate your findings you should also include heuristic analysis.
Still not sure how to handle segmentation? Take a look at our guide and review some more material about segmentation in Custom Reports.
Is a browser the culprit of your conversion problems?
You’ve already done some analysis but we still don’t have a straightforward answer to why our page is getting such a high bounce rate and few conversions. So it’s time you turn to cross-browser testing. This is the second pillar of technical analysis and it helps you to get a closer look at different internet browsers.
It’s crucial to make your site – whether mobile or desktop – fully functional and to ensure that everyone visiting it gets a great experience. Since not all browsers are equal, for instance they interpret code in different ways, this can cause some experience issues.
However with cross-browser reports you can spot these bumps on the road and fix them in stride. You should check whether a particular browser converts better or worse than others.
Step 1. Pick the right dimensions
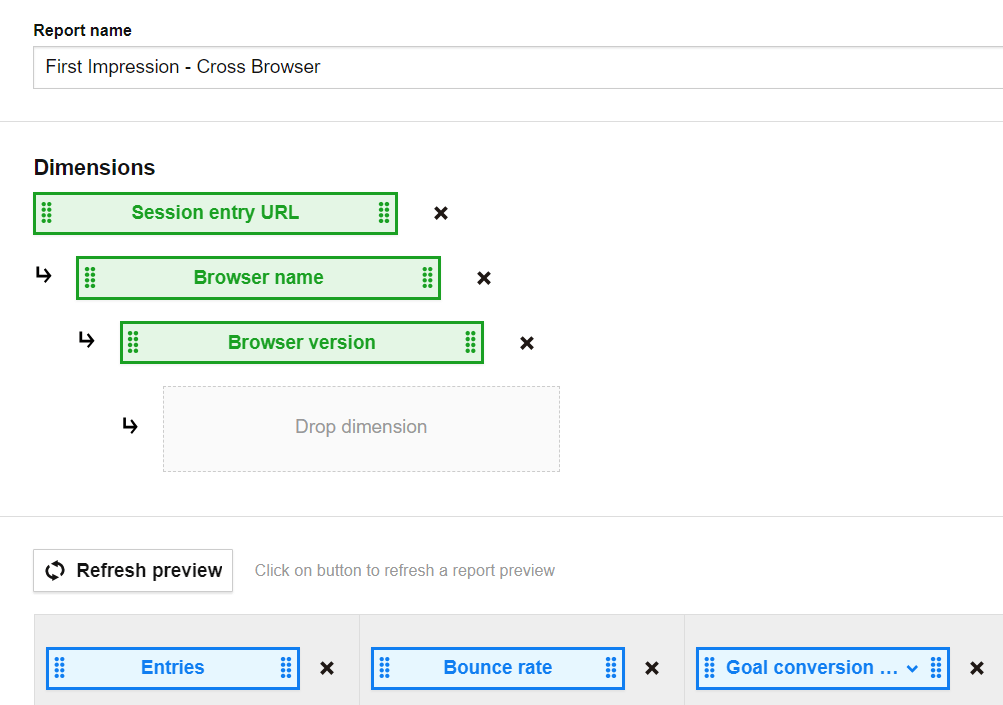
As to the first steps of the set up, select the required dimensions from the list then drag & drop them on the placeholder. Choose:
- Session entry URL
- Browser name
- Browser version
Since you can use the same metrics as in the previous report, your final setup should look like this:
Step 2. Search for warning signals – high bounce rates.
Now, with a complete a report at your fingertips, look for pages with the highest bounce rate and low conversion rate.
With just a quick look you can spot two pages that require your attention. The page that jumps out first reports a 99.88% bounce rate and doesn’t convert at all. That’s why we need to dig deeper to find out what’s going on.
Step 3. Check if it’s the browser creating conversion issues
Once you know which page makes visitors bounce, drill down and analyze if a particular browser is to blame.
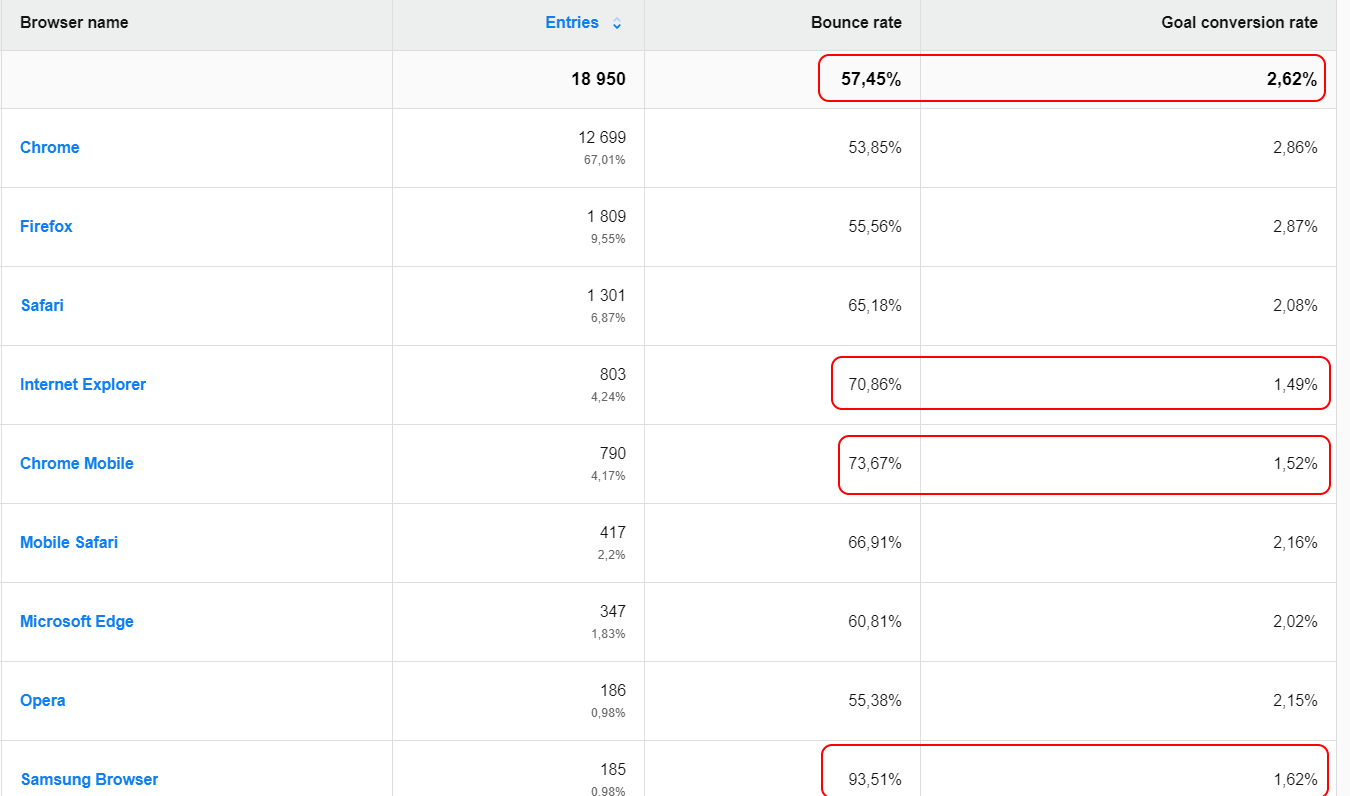
And here you can see right away that Samsung Browser has the highest bounce rate, at 93.51%, followed by Internet Explorer and Chrome Mobile, while the average rate is 57.45%.
Again, you might wonder if the problem is that the banner doesn’t scale right on Samsung Browser. Maybe it’s too big, it covers some key buttons and the user can’t actually browse the site. With such a high bounce rate you can expect some major issues, but at least now you know that Chrome users manage quite well.
The good news is, you don’t need to have direct access to all devices and browsers in order to run tests. You can simply use crossbrowsertesting.com and browserstack.com.
After these tests you can figure out where the problem might be, but you still don’t know why it occurs and what can you do to improve it. You need actionable insights, and a simple where is not enough. You need to know how to act on the data you have.
That’s why you should invest time into further analysis using methods like functional QA, heuristic analysis and qualitative research.
Does page speed cause conversion problems?
Since you still don’t know why your page is underperforming, it’s time to look from another perspective, that of page speed. That’s the final pillar of the analysis.
First of all, why you need to analyze it? The loading time of a site is one of the ingredients in user experience. If it’s too long, the experience is poor and users won’t bother to wait, so they bounce off your site.
Page load time has a tremendous impact on conversion – as a 2014 report found, 57% of users will abandon a page if it takes longer than 3 seconds to load.

That’s why a Page Speed Report comes in handy. And to help you out, we’ll show you a simple setup first.
Step 1. Choose the correct dimensions
First, choose the appropriate dimensions and drop them on the placeholder:
- Page URL
- Device type
- Device model
Step 2. Get the right metrics
Next, pick from the list metrics like:
- Page views
- Bounce rate
- Average page generation time
Note: matching bounce rate with average page generation time makes a powerful duo.
You should end up with a setup that looks like this:
Step 3. Spotting the red flags – high page generation time
Once the setup is done, have a look at pages that load too long. In other words, they have an unusually high generation time in comparison to the average.
Here you can clearly see the page that takes way too long to load. With an average time of 1s 55ms, our URL achieves a rather poor result of 1s 162ms loading time.
Step 4. Look at cross-device differences to find page speed issues
As soon as you find which page has trouble with loading time, you should check if it’s linked to a specific device.
So, have a look at what your report says.
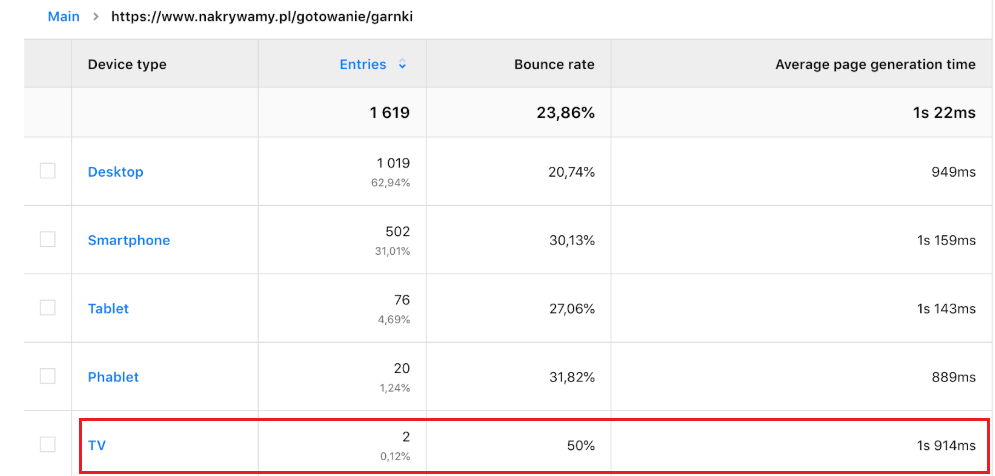
The numbers speak for themselves, and TV seems to be the troublemaker. Page generation time here is 1s 914ms. Compared to average time this result is way too long.
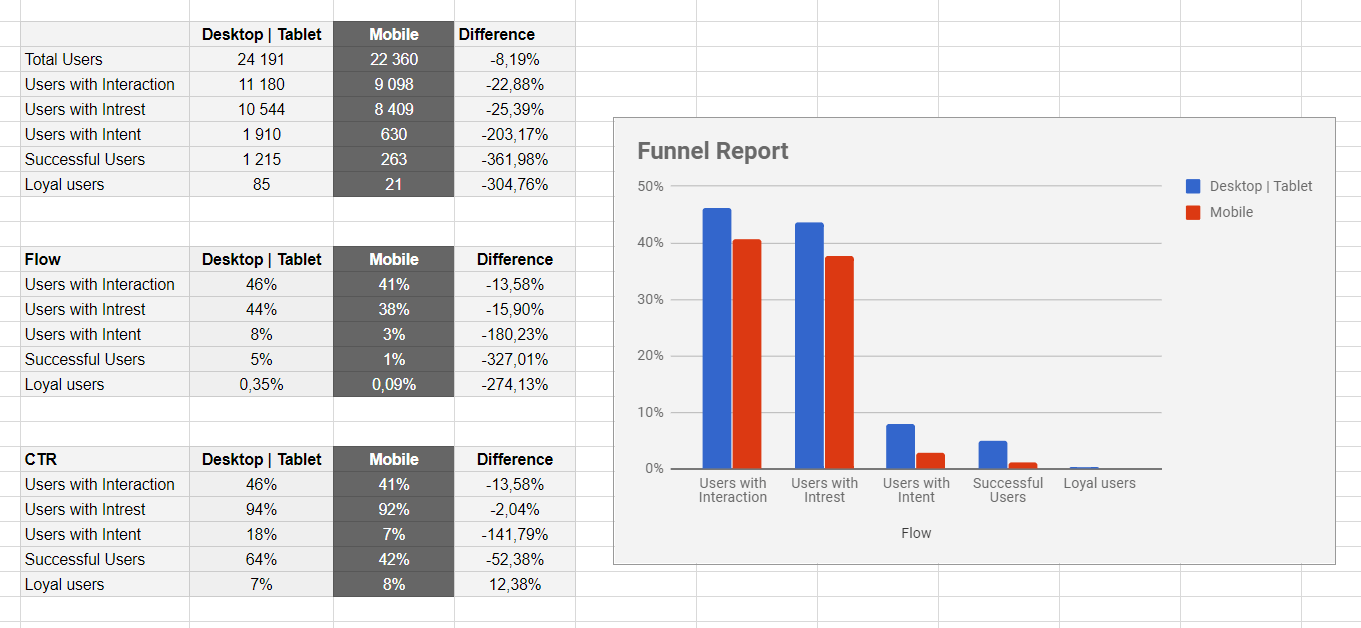
Take a look at one of the reports reviewed by Yehoshua Coren from Analytics Ninja:
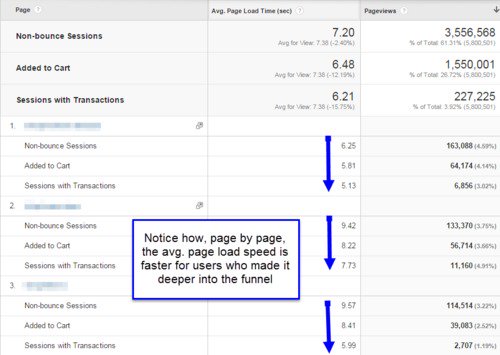
He compared the page load speeds of users who made it through different stages of the conversion funnel. What you get from this report is that page load is faster for customers who mange to go deeper through the funnel.
Pay special attention to pages that take so long to load so you can dig for more clues later on. Then get even more insights when you apply segments. Check whether certain devices have slower load times, or maybe it’s a matter of particular browsers, countries, etc.
Even if you can’t answer all these questions at once, you’ll still get some valuable hints. At least you’ve found room for improvement, namely you’ve identified which devices you should optimize for to provide a better experience to visitors and keep them on your site.
Free Comparison of 5 Leading Web Analytics Vendors
Compare 40 Variables of 5 Leading Enterprise-Ready Web Analytics Vendors:
If you’re wondering what you should do next, try to do a reality check on your web analytics findings. In other words, take advantage of tools available on the market and test the speed of your website, both on desktop and mobile devices. You can find various tools to help you with this job:
- https://testmysite.withgoogle.com/intl/en-gb
- https://developers.google.com/speed/pagespeed/insights/
- https://tools.pingdom.com/
Conclusion
We’ve tested the landing page to check why customers stumble when they come to your site for the first time. There could be many reasons why you’re experiencing high bounce rates and low conversion rates.
So eliminating real culprits like device and browser types is a good start.
But you need to dig deeper. Perhaps the landing page to ad copy mismatch report will lead to more answers.
The good news is that your effort has not been a waste. You’ve gained some significant insights. For instance, you’ve found out which pages work well, and these can pave the way for your optimization strategies.
Making a good first impression with your site might be tricky, but we hope that with this post we’ve helped you out a bit. We’ll soon have some more actionable advice and other cases to solve, so stay tuned. And if you’re eager to get some more answers now, just