
Some time ago we announced we were extending our offer with another useful module – Custom Reports.
The new addition to the PPMS was designed to help Piwik PRO users create actionable and clear reports quicker than in the standard Analytics module.
With this new feature the times when generating reports took hours and hours are now a distant memory. With a new database back end (we’ve switched from the row-oriented MySQL to the column-oriented ClickHouse) our users can create reports in real-time, without ANY delay. Sounds good, right?
However, that’s not the only advantage of the new module.
What you can do with the Custom Reports module
The main purpose of this product is explained in its name. It’s designed to allow you to create reports based on your own set of metrics and dimensions, not a pre-defined straightjacket.
That way, your dashboards will track only the data relevant to your business objectives.
It’s really hard to overestimate the power of the right information. If you want to learn more on this subject, we highly recommend you check out this blog post:
With Piwik PRO Custom Reports you’ll be able to customize your analytics dashboards using four different types of reports:
- Simple Flat Table
- Extended Explorer report
- Bar Charts
- Line Charts
Soon this list will also include Map-Based Reports and Pie Charts.
To give you a decent overview of how you can benefit from our new product, we’ve prepared a brief presentation of the characteristics of each type of report, as well as their sample configurations.
Let’s get started.

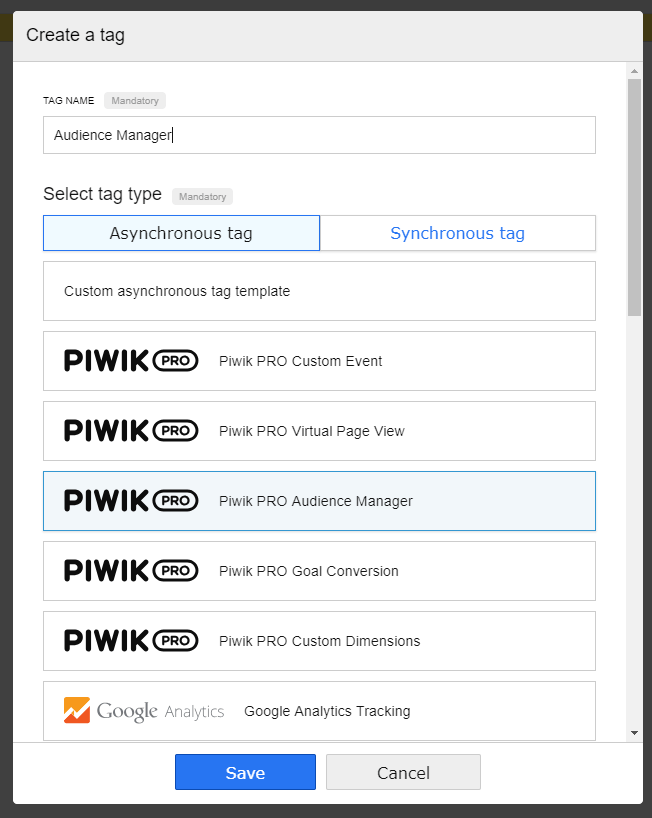
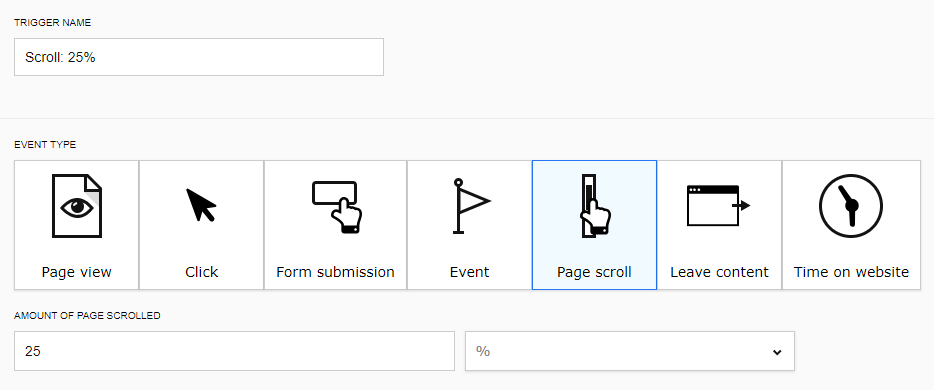
Let’s say that you want to create a report based on some custom events which you configured earlier. The events were set to fire when your user scrolled to 25%, 50%, 75% or 100% of your page.
Here’s what one of their triggers might look like:
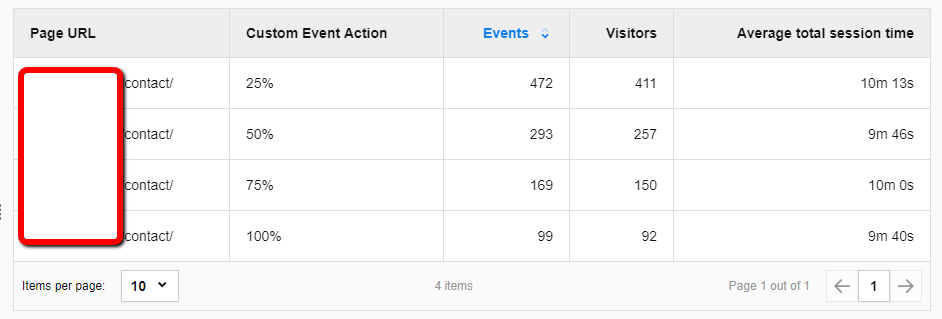
To get a clear view of these statistics, you can create a simple Flat Table report. It should contain data from specified subpages of your website, for example, a contact page:
With Piwik PRO Custom Reports configuring this type of report is a piece of cake.
Here’s how you do it:
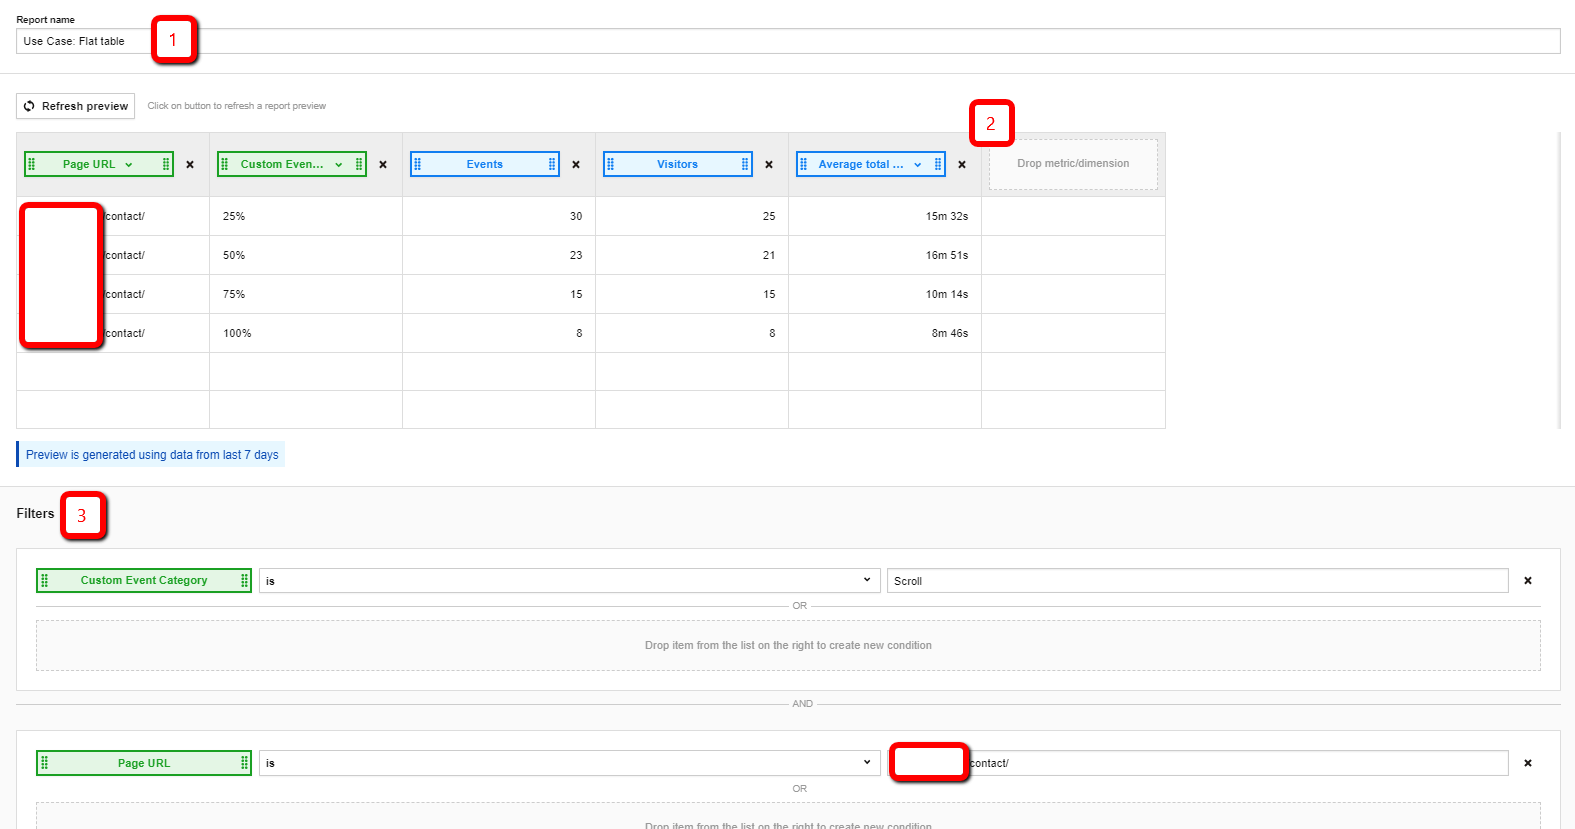
- You set the name of the report.
- You choose the dimensions and metrics the report will show (in this case: scroll).
- In addition, you can filter the report to show only a category of custom events for a single page (for instance, the contact page we mentioned above).
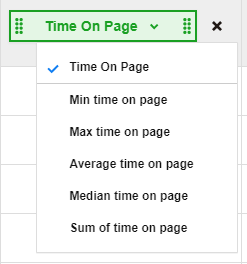
PROTIP: Piwik PRO Custom Reports give marketers the opportunity to create metrics out the dimensions. You can use not only average values but also medians, minimum & maximum values, and sums.
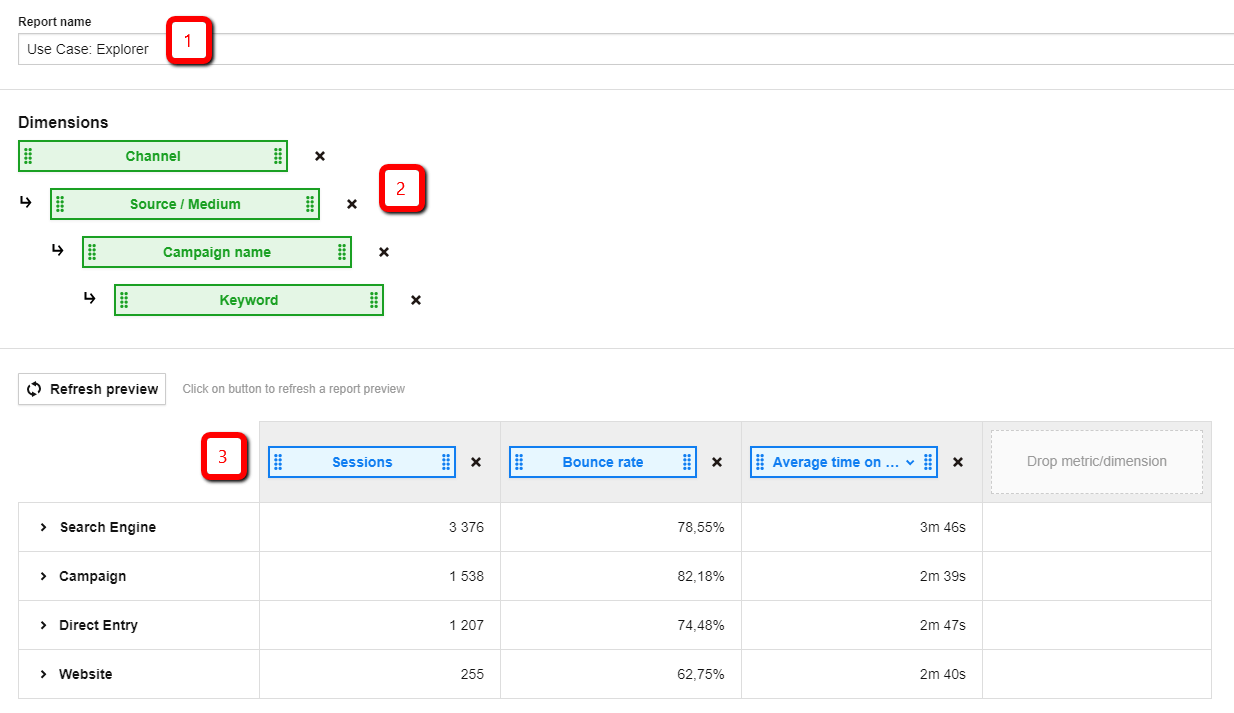
Now it’s time to look at a report you can use for more detailed information on a particular subject. For instance, let’s say you’d like to create a comprehensive report showing the effectiveness of all your marketing campaigns.
You’ll do that with a little help from a the nested table of the Explorer report. Let’s dig into the configuration – it’s a lot like before, but in this case:
- You give a name to your report (nothing new here).
- You choose up to four dimensions – one main and three subdimensions.
- You select your desired metrics (just like before).
The results of this configuration look like this:
What’s particularly helpful is that you can extend your report with additional information on each dimension and subdimension:
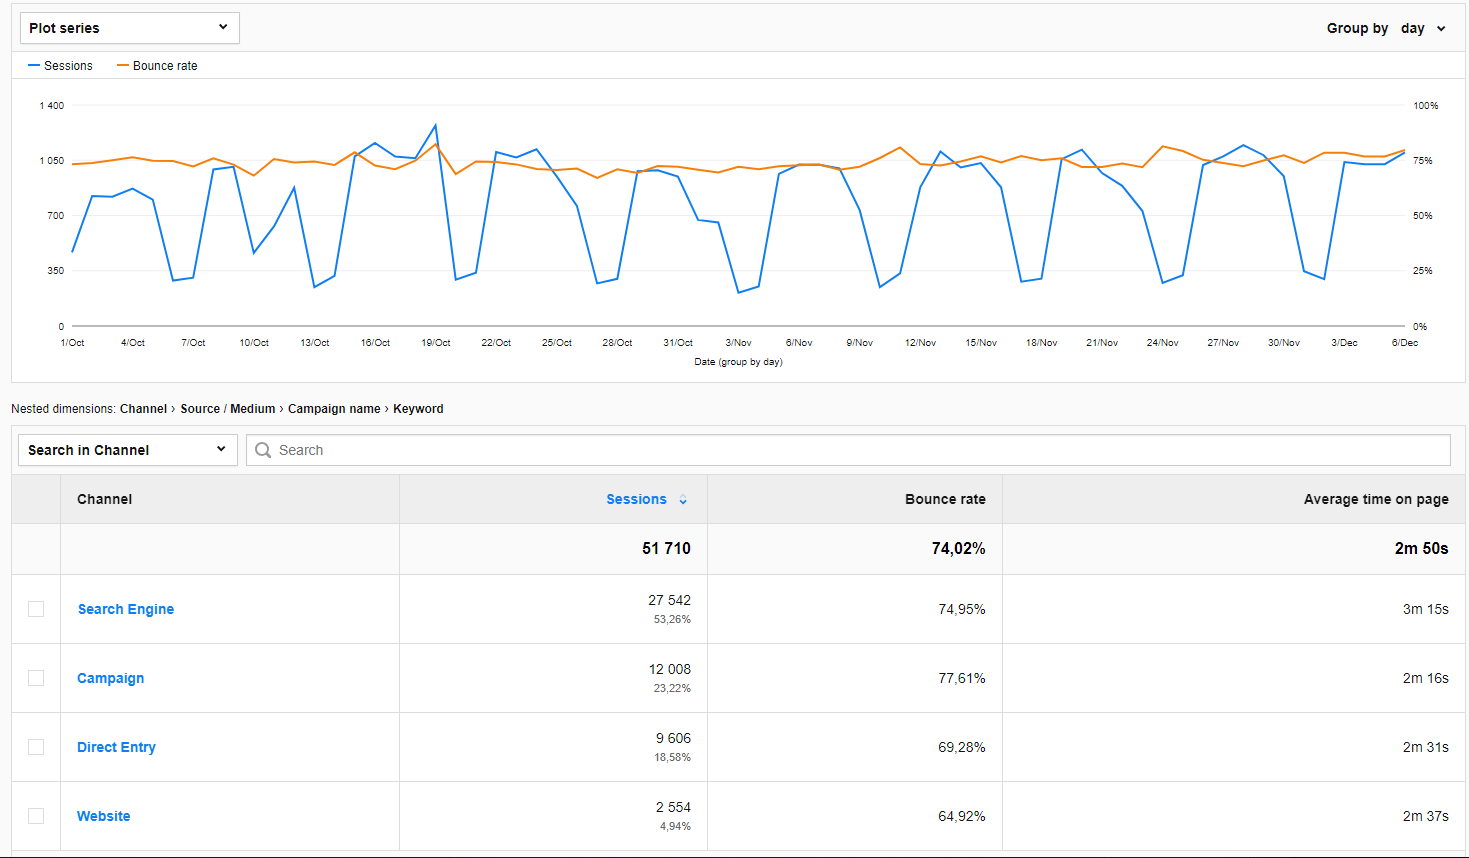
What’s more, by clicking on a specific item you’ll dive into the deep end of the configured report and obtain even more detailed data:
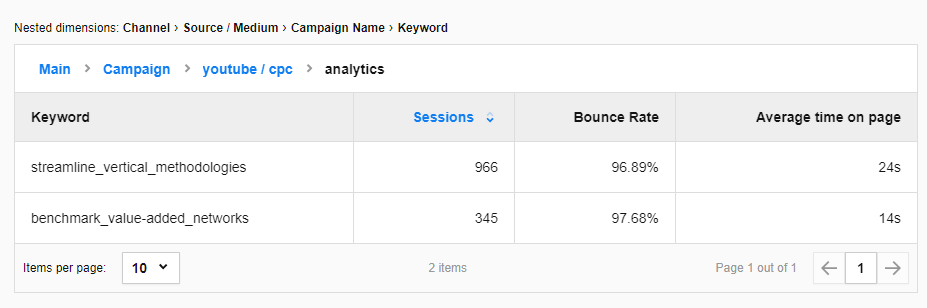
All that information in a single report. Pretty impressive, right?
Now let’s talk about a more visually appealing type of report – charts. There are situations where they might come in extremely handy.
First, a bar chart. Let’s say you want to create a report containing these elements: Visitors, Sessions, Average Total Session Time and Average Time on Page, divided by country but filtered to include only the DACH region (Austria, Germany, and Switzerland).
Setting up this report is a lot like setting up table reports:
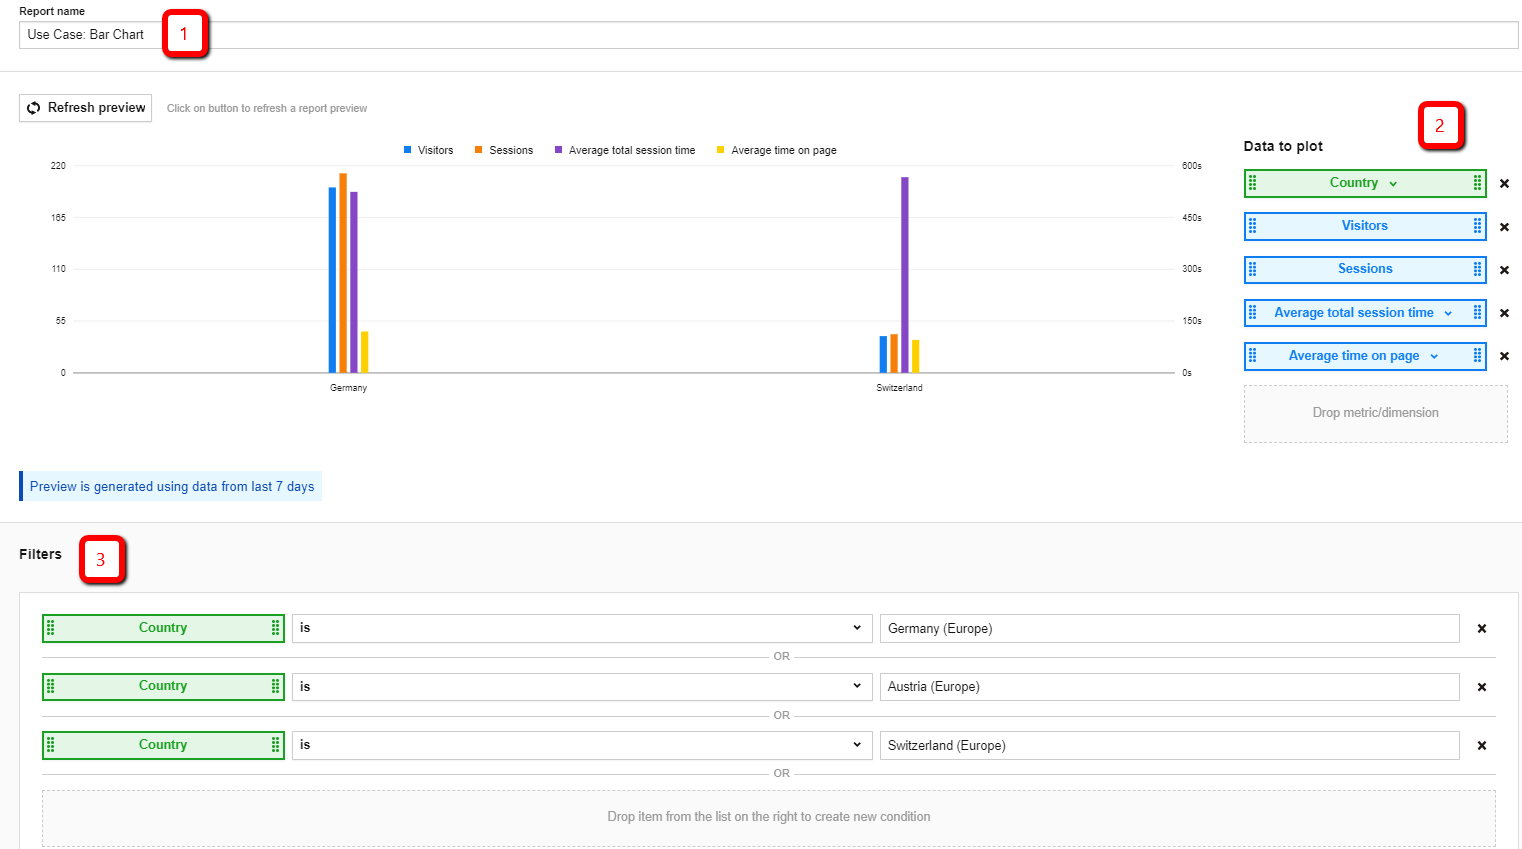
- As always, you have to name your report first.
- Choose which data you want to display. For instance, you can transform Total Session Time and Time on Page dimensions into metrics with average values.
- Filter the country dimensions to the DACH region countries using the OR condition.
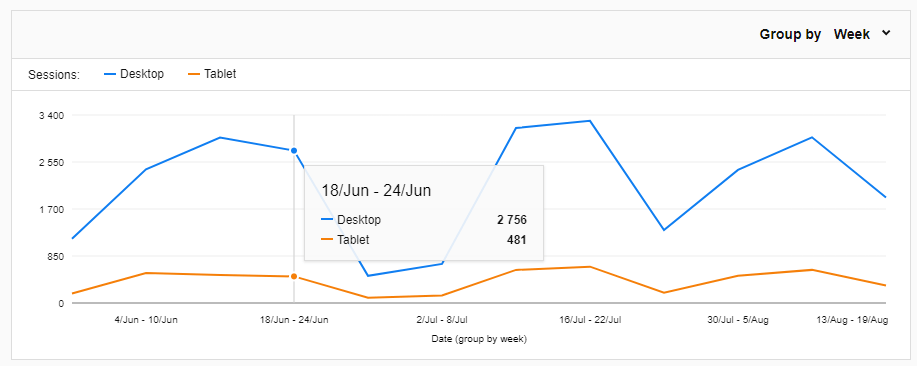
Now it’s time to demonstrate the last type of chart report – a line chart.
Let’s create a chart showing traffic over time for different types of devices (for instance, desktop and tablet):
Configuration of this kind of report is very similar to the ones we’ve discussed above.
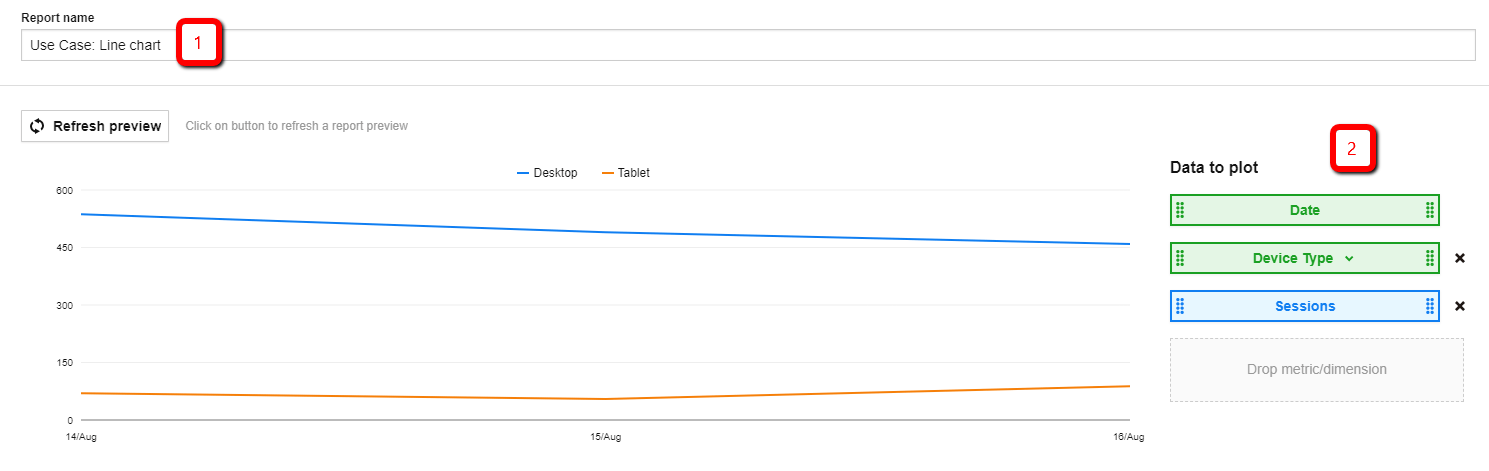
- Give your report a name.
- Choose the dimensions and metrics to be displayed on the reports (there will be more steps if you want to configure some
- additional filters).
PROTIP: Dimensions and metrics have to be chosen wisely – if the values differ a lot (for example, Sessions are expressed in thousands and Events per Session – in single digits), reports won’t be as clear as you want them to be.
To summarize
We hope that the examples presented above have given you a decent overview of what you can achieve with Piwik PRO Custom Reports. However, keep in mind that the number of possible configurations of Custom Reports is much greater.
Also, more features are coming soon, so stay tuned! If you have any questions about how Piwik PRO Custom Reports work and what reports can be created, just contact us.
If you’d like to learn more about the ins and outs of Piwik PRO Custom Reports, don’t hesitate to contact us! Our team will be happy to give you a tour through the functionalities of our exciting new product!