Statista estimates that the Apple App Store now contains over 2.2 million applications, and there are almost as many in the Google App Store. However, people typically use just 9 apps on a daily basis.
This means that app stores are filled with apps that don’t attract users’ interest.

According to data from Localytics, the biggest challenges app companies face are linked to customer retention. On average, apps lose two out of three users to churn within 90 days after they download the product.
To ensure good user experience, organizations need to collect quantitative data about user behavior inside their digital products. By analyzing such data, they can detect and fix the weakest links to better engage and retain users.
In recent years, product analytics has proven itself as one of the most efficient tools for this job.
According to McKinsey:
Companies that use customer analytics comprehensively report outstripping their competition in terms of profit almost twice as often as companies that do not.
It’s also used by many market leaders, including Spotify, Netflix, Zalando and Uber.
What is product analytics?
Product analytics is an approach focused on understanding how users engage with what you build. This involves using dedicated tools with the capabilities to map user interactions within your product.
Product analytics
Helps you understand how users navigate your application, which features increase their engagement, and how to improve their long-term retention.
On top of that, it allows you to track users’ digital footprints, analyze their flow, and see what makes them convert, return, or churn. You also start understanding what value your users are getting out of your product.
The key questions answered by product analytics
Product analytics allows you to address some critical questions that wouldn’t be answered by the regular approach to analytics. For instance, you’ll learn:
- how frequently certain features are used
- what people actually use the app for
- what marketing channels are driving the best users
- where your users are getting stuck in your onboarding funnel
- how many users are completing a critical event
- how many users return to your app daily/weekly/monthly
- what the characteristics of your most engaged users are
The data collected by product analytics can be further used by product managers, developer team leaders, UX designers, and growth managers. Insights collected with analytics allow them to increase customer satisfaction, clean up bugs, and resolve other issues affecting the overall performance of the product.
The 4 main differences between product analytics and marketing analytics
Some may think that product analytics is the same old thing dressed up in a mask and cape. That’s why it’s important to know the differences between product analytics and marketing analytics. Here you can find the most important distinctions between them:
1) Product analytics makes events its core data source
In regular web analytics, it’s quite easy to define which user actions are considered a conversion. These might be, for example, purchasing a product, filling in a contact form, or registering for a webinar.
The same goes with defining your marketing funnel – you can link your goals to the URLs or certain user actions, quickly getting a good overview of how people move through particular stages of the customer journey.
Product analytics is a bit more complicated. Defining goals and funnels is way less obvious. Each app has a unique structure and set of features.
To map your product goals you have to first translate them into desired user actions, such as uploading a picture, playing a song, or completing a meditation session, and then pair them with particular events and triggers.
Psst! If you want to learn more aboutevent tracking, you’d better check out this page.
This means that with product analytics, you’ll have to devote a lot of time to setting the whole thing up.
Compare 6 leading product analytics platforms
Piwik PRO Enterprise, Mixpanel Enterprise, Amplitude, Heap Premier, Countly Enterprise and Pendo Enterprise.
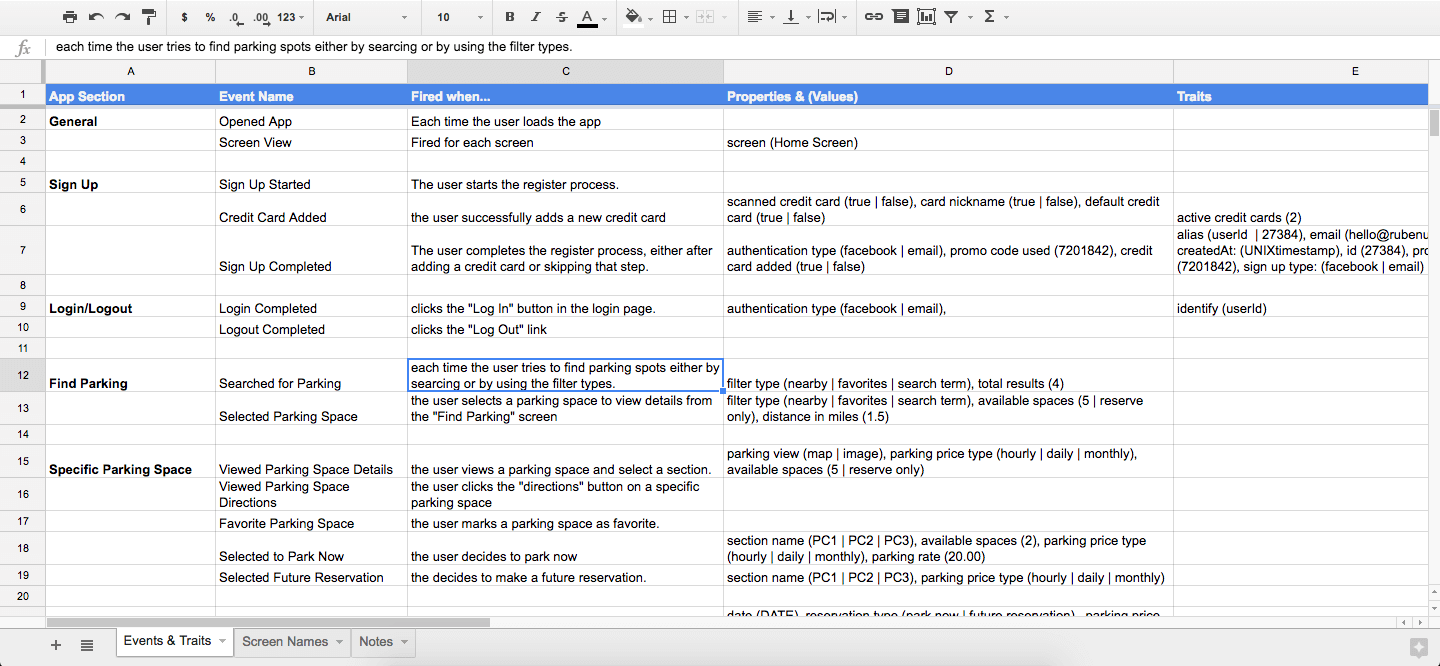
You’ll need to create a tracking plan that contains all the events and properties you want to track. Doing this planning in a spreadsheet will help you avoid critical errors and connect events with your business goals.
Events, however, are not the only source of information in product analytics. Like in every other type of analytics, you can also use numerous other features and reports to pin down the most valuable information about your users’ behavior.
Other common reports and features used in product analytics:
- Segmentation: helps you understand who your users are and lets you segment them by device, time, region, and behavior
- Funnel and user flow analytics: shows how users navigate through particular stages of their journey within your product
- Cohort analytics: allows you to compare the behavior and metrics of different cohorts over time
- Display dashboards: serve to visualize your main KPIs reflecting different stages of your customers’ lifecycle: acquisition KPIs, onboarding KPIS, activation KPIs, conversion KPIs, retention KPIs, feature adoption KPIs, etc.
- Retention reports
2) Product analytics revolves around mature stages of the customer journey
Marketing (or web) analytics is often focused on acquisition and conversion. It gives you insights that help you convert your visitors into paying clients or subscribers.
Product analytics, on the other hand, is more retention- and engagement-oriented. When it comes to apps and other digital products the measure of success is not how many people download or buy what you’ve built. It’s how many of them continue to use it and engage with it after a week, a month, or a year.
Data collected by product analytics software helps you find answers to questions about more advanced stages of the user journey, such as:
- User activation: where people drop off when they’re onboarding onto your product or how many features they use during their first visit
- User referrals: which users are the most likely to invite other friends to use your product
- User engagement: which features people use the most or the least, how often they use your product, average visit duration
- User retention: which users are likely to come back and which users are unlikely to return, what is the user retention rate
3) Product analytics uses different kinds of metrics and goals
All we mentioned above affects the metrics and goals typically used in product analytics. In most cases they’re strictly related to your product design objectives.
One of the most popular frameworks for defining product analytics metrics and goals is the HEART framework. It was developed by the Google Venture Team and consists of five different categories of metrics:
- Happiness: measures attitude or satisfaction (typically through some sort of user survey)
- Engagement: measures the frequency, intensity, and depth of user interactions with a product
- Adoption: measures how easily, often, and quickly users adapt to the new features of the product
- Retention: measures how many existing users retain in a certain amount of time
- Task success: measures the effectiveness and efficiency of the tasks users complete within your application
The main advantage of the HEART framework is that it’s extremely user-centric and allows you to measure the quality of the user experience. What’s more, it’s a really flexible approach. It can be used to evaluate and measure overall advancements made towards the main objectives, or simply to evaluate the performance of each feature separately.

If you want to read more about using the HEART framework in product analytics, this extremely informative blog post by Olivier Blais of GSOFT might come in handy:
Product Analytics — How to Measure Your Software Development Success
4) Product analytics operates on more sensitive data
There are also differences in the types of data the tools collect and the responsibilities entailed.
Web analytics analyzes traffic on marketing websites and takes advantage of publicly accessible information. And in the case of product analytics, a huge part of what you want to measure takes place in secure member areas in your app or product.
What are secure member areas?
Any part of an app or website available only after login. Secure member areas are where your customers order products, buy new services, schedule appointments, check their credit card balance.
Those areas of your app are filled with personal and in some cases even sensitive data about your users:
- home addresses
- telephone numbers
- names and surnames
- sometimes even medical records or credit scores
If you decide to analyze and use this information, you must be sure that your software provides the highest level of security.
The main difficulty is that most of the product analytics solutions available on the market operate in the cloud environment. And as you probably know, using software in the cloud means you’re storing your data on third-party servers located… somewhere on planet Earth. Also, it involves sharing data with your product analytics provider.
That’s why in some cases it’s worth considering other options like:
- a private cloud, or
- an on-premises product analytics solution
Both solutions will ensure that the data is never shared with a third party. However, by going for on-premises analytics, you can also encrypt data or use your preferred SSO authentication method to tightly restrict access to it.
That way you’ll make sure that acquiring valuable insights into your users’ behavior won’t come at the expense of the security of information they share with you.
Although most product analytics solutions can’t meet those expectations, there are a few of them that will. One is Piwik PRO Analytics Suite, which can be stored on your own cloud subscription, in a private cloud in a dedicated database or on dedicated hardware, or with Piwik PRO Cloud services (offering secure servers located in the US, Netherlands, France, Hong Kong, Sweden and Germany).
If you want to read more about the features of Piwik PRO, be sure to see our page dedicated to product analytics.
Getting started with product analytics
We hope that this article has given you a decent overview on the most important characteristics of product analytics and the most common threats involved in dealing with your users’ sensitive data. We even hope it’s enough for you to start collecting and analyzing data yourself. That said, we know there’s a lot left to say, both about digital products and analytics in general.
read also
Free comparison of 6 leading product analytics platforms
Compare over 30 differences between Piwik PRO Enterprise, Mixpanel Enterprise, Amplitude, Heap Premier, Countly Enterprise and Pendo Enterprise.