Underperforming pages are the bane of every conversion rate optimization process. Never fear, we’ve got the perfect solution to your struggles! In this blog post we’ll show you how to deal with poor website performance using a Piwik PRO Analytics module.
Last year’s Conversion Rate Optimization Report 2017 by Econsultancy has shown that
only about 22% of businesses are satisfied with their conversion rates.
That number’s not too impressive, is it?
This is especially true when taking into account that low conversion rates have a direct impact on the company’s bottom line.
Of course, there can be many sources of this problem. Nevertheless, marketing websites and their performance play a large role in achieving your desired conversion rate.
The numbers speak for themselves. According to the survey by Akamai and Gomez.com,
79% of online shoppers who visited poorly-performing websites say they won’t return to the site to buy again. What’s more, around 44% of them would tell a friend about their bad experience.
Ouch.
Fortunately, today’s marketers have access to multiple sources of information on their websites’ operation. One source is analytics reports. When used skillfully, they can provide you with extremely relevant data to help you detect and fix underperforming pages.
In this blog post we will show you how to use website performance analysis to achieve the results you need. To make the whole thing easy to digest, we’ll divide this process into three practical steps, with a bunch of useful tips thrown in to help.
Sounds good, doesn’t it? Let’s get started!
STEP 1: Study your conversion funnel (and make sure it’s configured right)
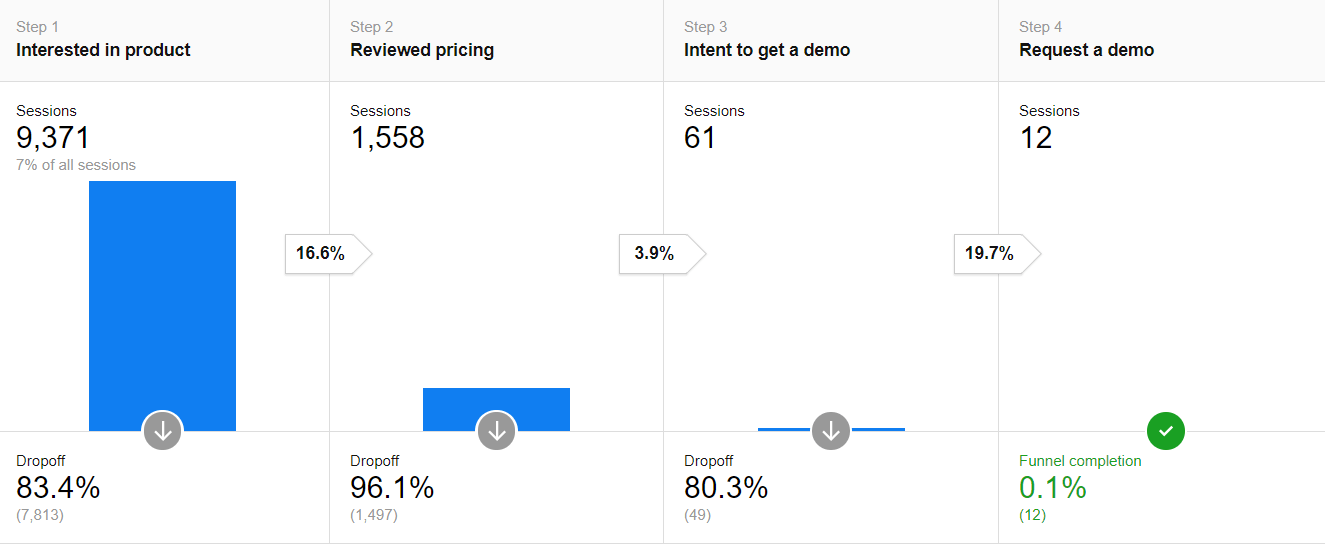
The first place you should start looking for potential bottlenecks (factors that limit performance) is in your conversion funnel report. Its shape will help you detect the exact stages of the customer journey that you should start paying special attention to.
Important note! If you’re still not familiar with conversion funnels, don’t worry. Click here to find an example of a simple funnel setup: Conversion Funnel: Set It Up Like a PRO! Be sure to read this material carefully – you’ll find a lot of helpful tips in there!
With that knowledge it will be much easier to spot the underperforming areas of your website you need to work on. It will also help you figure out exactly what you should change in order to improve them.
Let’s review what a proper conversion funnel should look like. We’ll assume that in a correct one each step has a 50% conversion rate. A bottleneck is understood as a decrease from 50% to 10% in one section of the funnel.
In this case a healthy funnel would take the following shape:
However, problems at certain stages of your funnel can significantly alter its shape. For instance, your funnel might be:
- really wide in the top section
- thin in the middle section
- extremely wide in the middle section
- really flat at the end
- in the shape of a tube
In each of this scenarios you certainly fall short when it comes to providing enough value to your prospective customers. You can read more about unusual funnel shapes in this article by Riverbed Marketing.
At each step of the customer journey there can be different reasons for poor website performance.
Here are the most common problems associated with particular funnel stages:
Bottleneck at the top of the funnel
Type of page: Landing page
Type of user: Visitor
- Not enough traffic on your website
- Technical problems with the website (page speed, 404/500 errors)
- Poor quality of content
Bottleneck in the middle of the funnel
Type of page: Whitepaper download webform
Type of user: Lead
- Page copy not related to ad copy
- Serious problems with webforms
- Too many fields in your website
Bottleneck at the bottom of the funnel
Type of page: A page where your users schedule a free consultation or product demo
Type of user: Marketing qualified lead
- Quality issues with Thank you page
- The materials you’ve prepared for users are not engaging enough
As you can see, the main issues with your website – regardless of the stage of the customer journey – boil down to the following scenarios:
- Your website is experiencing some technical issues
- Usability problems. For instance, your webforms are not appealing to users
- Your content lacks quality or is not interesting enough
In the next section we’ll show you how to identify the constraints on the volume of people visiting your website. Then you’ll learn how to eliminate them using Piwik PRO Analytics.
STEP 2: Detect problems and fix them
Here are some practical tips on spotting problems and improving websites that underperform:
#1: Technical issues
According to the previously mentioned report by Akamai and Gomez.com, 50% of users expect a site to load in 2 seconds or less, and they often abandon a site that doesn’t load within 3 seconds.
And just imagine how frustrated people are when they arrive at a website where, instead of the product or service they’re interested in, they find a non-existing page.
Fortunately, although such problems quickly discourage potential customers, they are the easiest to track and repair. This is how we tackle them successfully:
USE CASE 1: Identifying 404s with Piwik PRO Custom Reports
When it comes to finding 404 pages, you can easily create a Custom Report listing all 404 page occurrences. Just add the unique value of Page Title and use it to filter the report. Add Previous URL as a nested dimension and check where the broken URL can be found.

The obvious benefit is that knowledge of where users stray from the path will help you identify the weak spots on your website, improve the user experience, and boost conversion by retaining users on the page for longer periods of time.
That way, you’ll be able quickly detect and eliminate problems related to broken or dislocated pages.
Free Ebook: How to Improve the Digital Journey in Healthcare with Web Analytics & Personalization
Learn all the important aspects of optimizing the customer experience on your patient-facing platforms while remaining in full alignment with data privacy regulations (including HIPAA & GDPR)
USE CASE 2: Finding subpages with technical problems using Segments
Many technical problems can be identified using Piwik PRO Custom Segments. To achieve the desired results, you could for instance segment your users by:
- Browsers: to see if you have any compatibility issues.
- Operating system: to see if mobile users are receiving a satisfying experience.
- Screen resolution, flash version, or java support.
- Geography: maybe your site loads really slow just in certain regions?
This tells you which pages require optimization to ensure better user engagement with your offer.
#2: Usability issues
There are a lot of websites out there. And some of them are so user-unfriendly that visitors leave as quickly as possible. Unfortunately, in most cases they never come back.
According to UXeria, 88% of online customers declare that they don’t return to websites which they found unuseful.
The list of sins on pages with low usability is quite long. In this blog post by Kissmetrics you can read about the cardinal ones: 7 Usability Mistakes That Will Kill Your Online Sales.
In our experience, one of the biggest mistakes that reduce conversion rates are badly designed website forms. Too many fields or a bad location for the form can significantly limit the number of people signing up for your webinar, ebook, product demonstration, or whatever else you’re offering.
How to fix it?
USE CASE 3: Identifying problems with webforms using various Piwik PRO reports
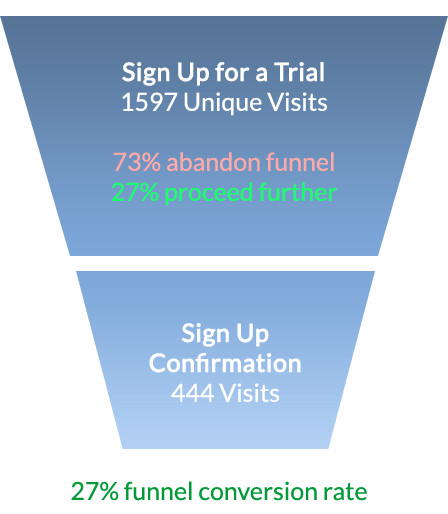
In order to spot problems with your webforms, you should once again look to your conversion funnel. It will provide you with information on how many users decide to actually leave their data in exchange for the materials you’ve prepared for them:

With that knowledge you can go further and seek explanations. One thing you could do is divide your funnel into segments and see if you can spot some usability issues (affecting only a particular OS, browser, or screen resolutions).
If you really can’t tell what’s making them leave your page, the chances are high that the problem is related to the quality of your copy (more about copy later in this blog post) or the structure of webforms on your site.
One piece of advice! If you want to investigate more deeply how people behave on your website and which parts of it bother them, we recommend this blog post: How to Blend Web Analytics & Crazy Egg for Conversion Boosting Glory. There you’ll learn how to pair Piwik PRO with Crazy Egg (a heat map and scroll map reporting tool) to acquire even more detailed user insights.
Practice shows that limiting the number of fields in forms to the absolute minimum is usually a very good idea.
Statistics presented by Unbounce.com show that you can increase conversions as much as 120% by shrinking forms from 11 fields to 4.
There’s a really good chance this solution work in your case.
If you’re still not convinced, this extremely well-researched article by ConversionXL may dispel some of your doubts: Should You Really Reduce Form Fields?
#3: Poor ad copy
According to Kissmetrics, bad content structure and boring content are two of the main reasons why people decide to leave a website.
How can you see if this problem affects you? Poor content that doesn’t engage readers is recognizable by low conversion rates and high bounce rates of pages. So, if your analytics reports point to this type of problem and you can’t spot any other issues (like ones related to usability or technical problems), poor content might be the reason why your visitors are deciding to leave your page.
Of course, we expect some pages to have a high exit rate (for example, a blog post page where users don’t find anything else that would keep them from leaving). But a high exit rate for landing pages certainly means that your users aren’t behaving the way you’d like them to.
USE CASE 4: Spotting low-quality content using Exit pages reports in Piwik PRO

Fortunately, this type of issue can be spotted in an Exit pages report.
As you can see, this comparison generates a ton of actionable information. You can identify whether there are any vital pages on your website with high exit and bounce rates. In addition, you can also see if users are exiting your site in the places you expect them to.
This gives you the knowledge necessary to know which pages require optimization so you can ensure better user engagement with your website’s offer.
Looking for inspiration on how to improve your website’s content? This exhaustive guide by Neil Patel will certainly give you some actionable ideas: 13 Ways to Reduce Bounce Rate and Increase Your Conversions.
STEP 3: Test your ideas!
Information from analytics reports can definitely give you some ideas for improvements you can implement on your website. Remember, however, every hypothesis should be tested using the A/B test method. This method will tell you exactly which changes can contribute to increased conversion rates and greater user satisfaction.
A/B testing is used to test different elements of web content by comparing two versions, usually planned changes vs. the original.
We think that the best way to perform these tests is by pairing Piwik PRO Analytics insights with the capabilities of Piwik PRO Tag Manager and Optimizely. Learn more about it from this blog post: Launching A/B tests using Piwik PRO Tag Manager and Optimizely.
Website performance optimization – some conclusions
We hope that our guide has provided you with some actionable tips on how to perform a proper website performance analysis. However, we’re aware that you still might have some unanswered questions.
If this is the case, don’t hesitate to contact us and share your thoughts – our team will be happy to help you!