
Let us show you how applying segments will help you pinpoint problems ruining your funnels’s performance.
Funnel visualization reports are used so often they have become an indispensable part of web analytics.
It comes from the facts that:
- In most cases they are easy to set up and offer a decent overview on your website/app performance within a few weeks of collecting your analytics data
- They can provide valuable insights on how to boost your conversion rates
However, you have to be aware that with funnels alone you barely scratch the surface of optimization insights.
Why? Because with funnels you’re still operating on aggregated data. And aggregated data suggests that every visitor is the same, which is false.
After all, there are many different types of visitors entering your website or app. They use various browsers and devices, have different demographics, and experience different problems that make them abandon your website.
Unfortunately, you won’t be able to spot that, unless you decide to slice and dice your data. That’s why it’s extremely important to break your funnels up into segments. Thanks to that, you’ll be able to dig really deep and reach informed conclusions on what is ruining your funnel’s performance.
Power up your funnels with segments – a step by step guide
The rules are quite simple. Now, you probably treat progress at each step in your funnel as a separate KPI (eg. step conversion rate, step success rate, step drop off – you name it). But to gain some in-depth insights on your conversion problems it’s extremely helpful to break your KPIs even further by applying different segments.
Never report a metric (even God’s favorite KPI) without segmenting it to give deep insights into what that metric is really hiding behind it.
Avinash Kaushnik
Needless to say, the whole operation should be performed only under two conditions:
- you know what the stages of your funnel are (among other things, you defined what actions your visitors must undertake in order to “convert” on each step of the funnel)
- you’re 100% sure you configured them right in your web analytics panel (it’s worth to double check, everybody makes mistakes)
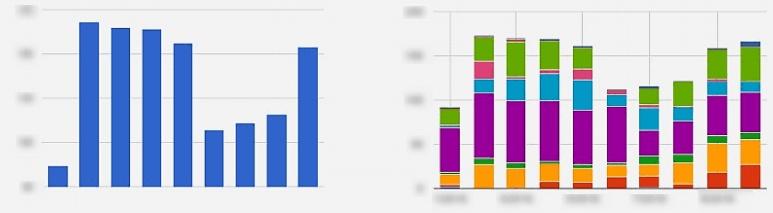
Free Comparison of 5 Leading Web Analytics Vendors
Compare 40 Variables of 5 Leading Enterprise-Ready Web Analytics Vendors:
Psst! Here you can find a helpful guide in how to set-up a funnel in a right way: Conversion Funnel: Set It Up Like a PRO!
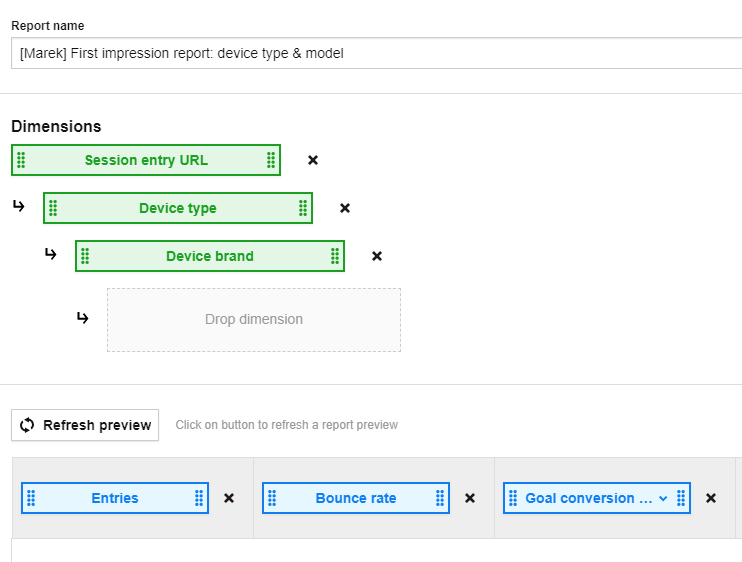
Below you’ll find the whole process divided into easy steps and demonstrated on a sample funnel configured in Piwik PRO analytics:
1) Study your funnels to find conversion problems
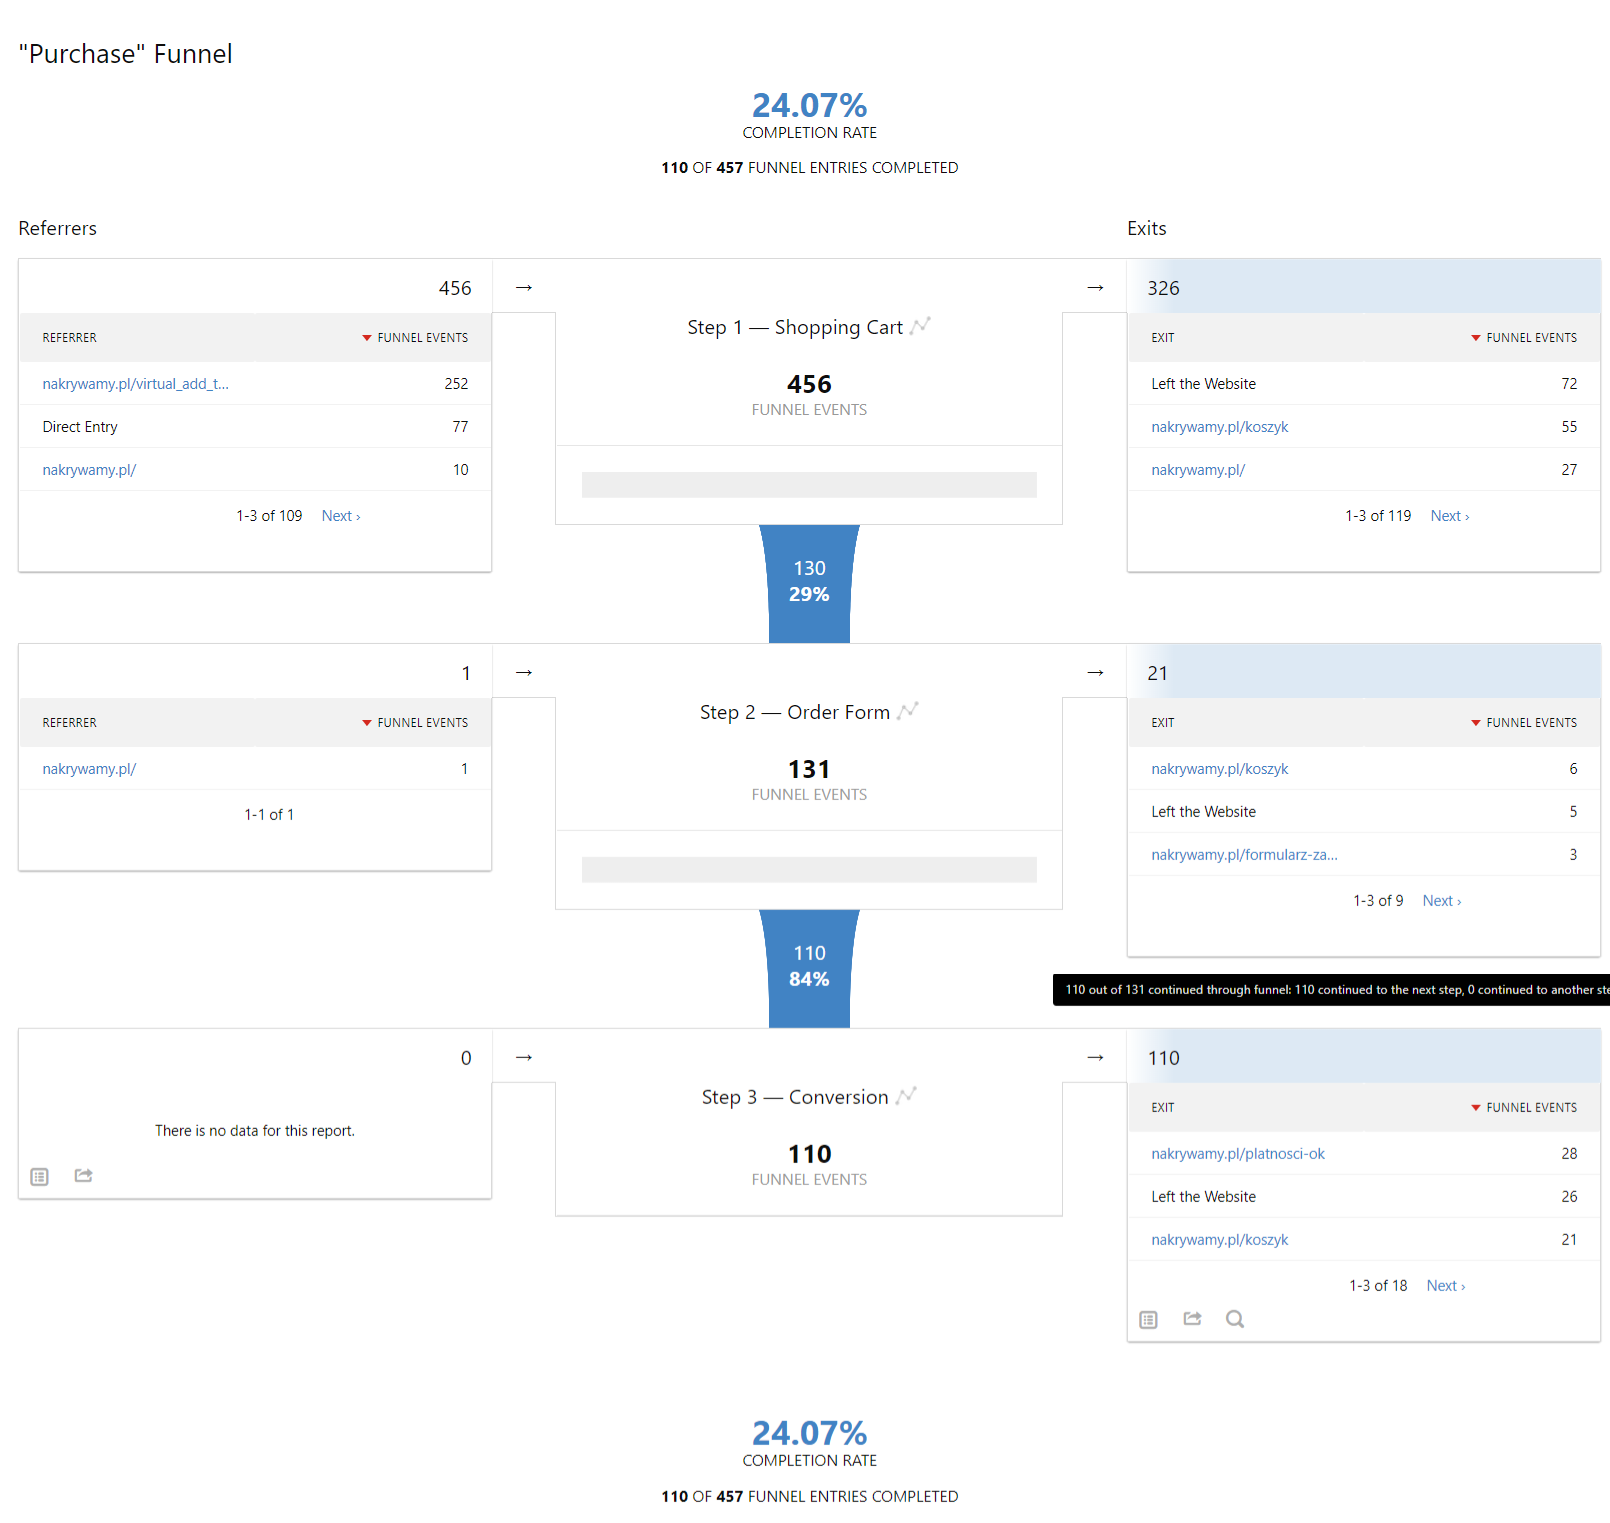
First, let’s have a look at a sample funnel set-up:
Note: If want to learn about different funnel configurations, follow the links below:
What you see is a typical e-commerce funnel consisting of 3 elements:
- Shopping cart
- Order form
- Order Confirmation Page / Thank You Page
A quick look at the progress stats at each funnel step allows you to pinpoint the bottlenecks where you lose the most customers:
- You have nearly 58% customer drop-off between shopping cart and the order form
- You have nearly 11% customer drop-off between order form and the order confirmation page
Those are some pretty useful insights.
They tell you that 11% of people who were eager to buy from you somehow struggle with the order form and eventually leave the funnel.
Also, you can see a quite big drop-off at the shopping cart. It’s definitely something to expect on e-commerce websites, but still, it won’t hurt to take a closer look.
You’ll do that by segmenting the funnel KPIs. In this case that will be drop-off rates at each stage of the funnel.
2) Segment your funnel KPIs
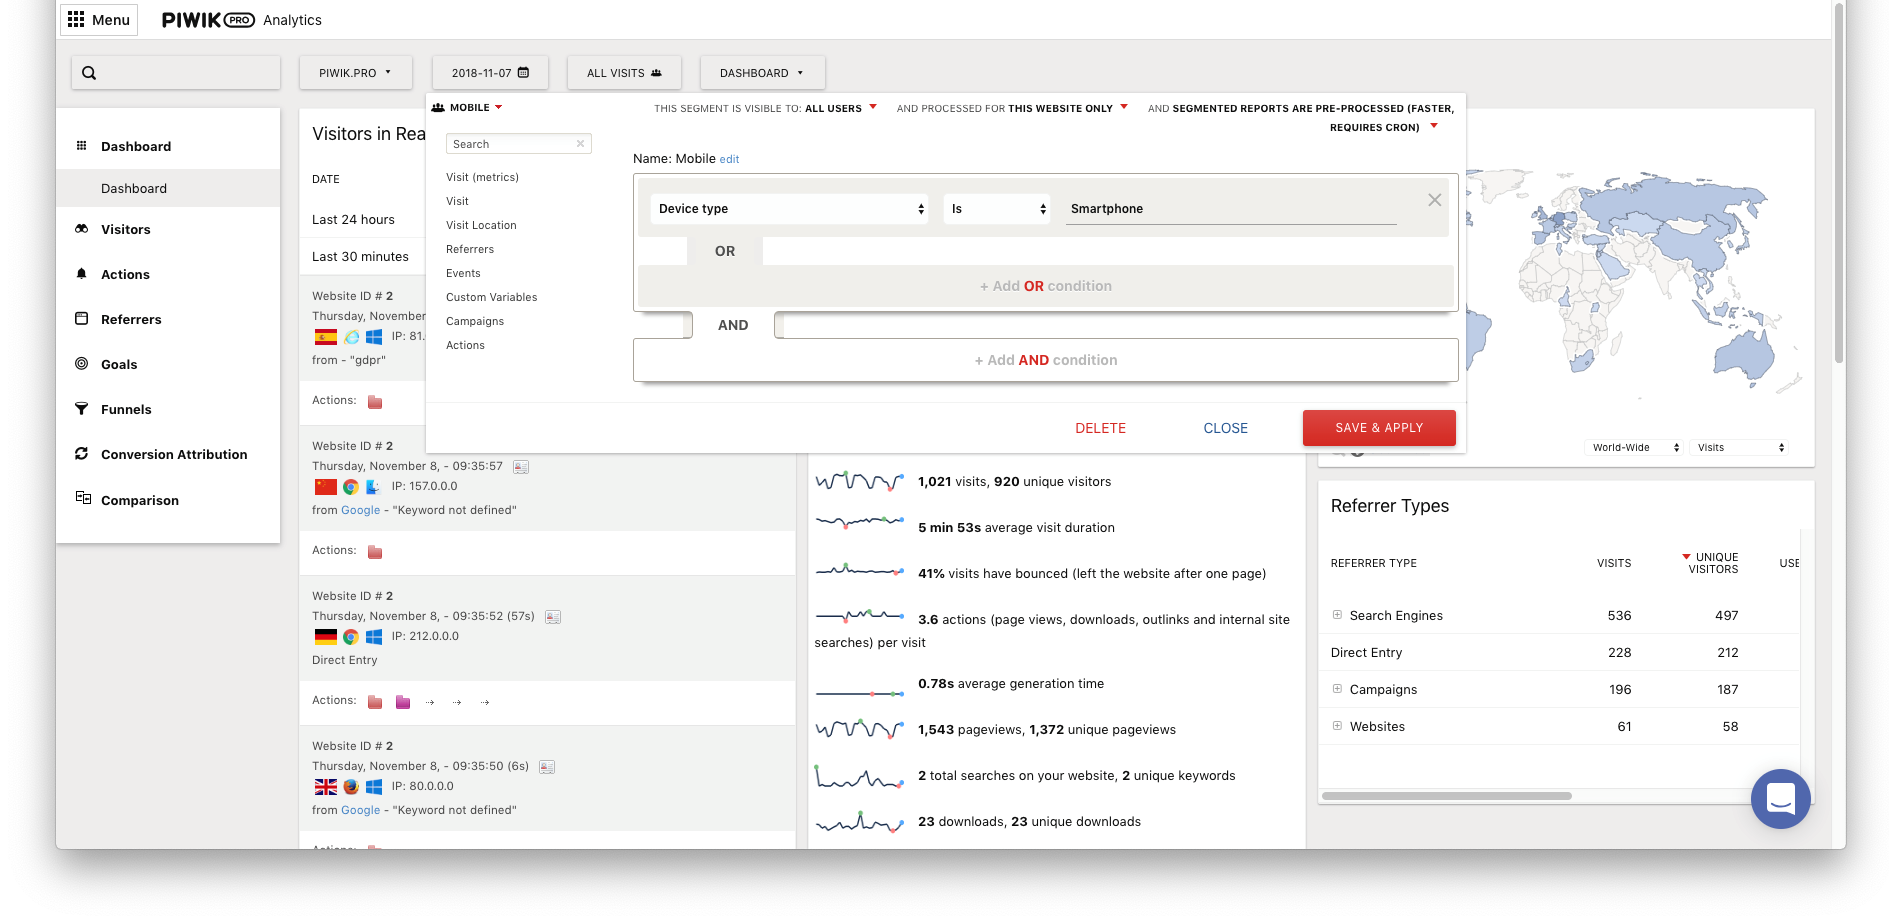
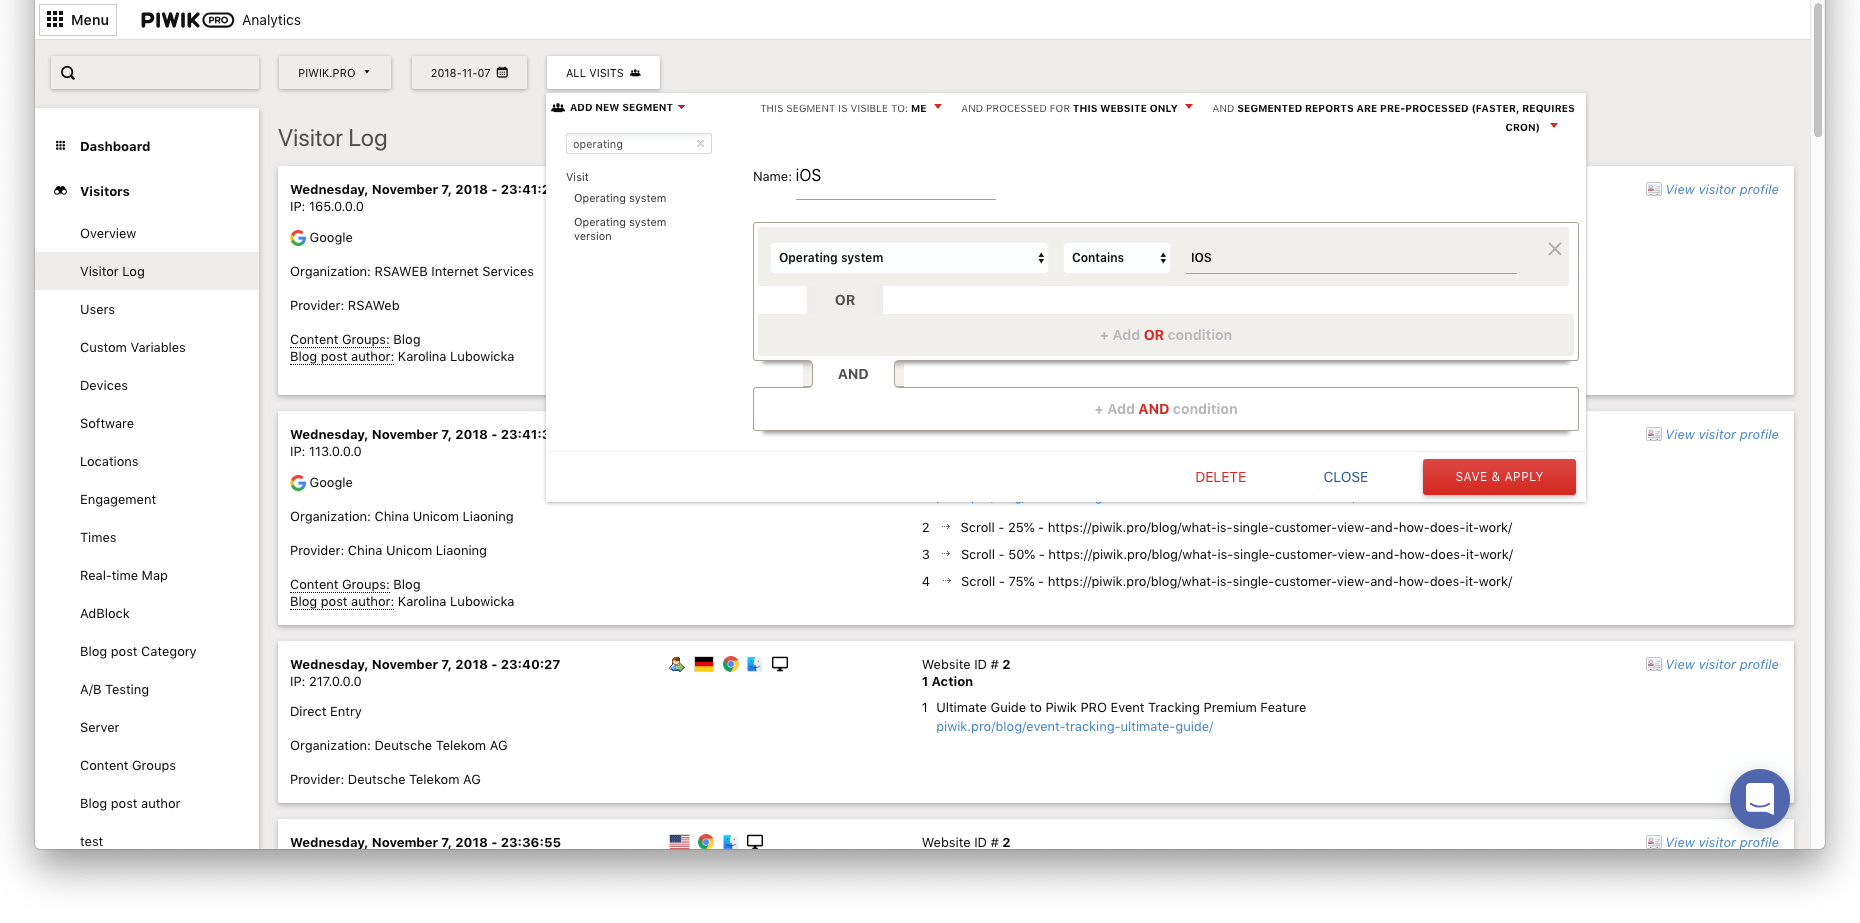
To define a segment, click on the segment drop-down menu at the top of the page, followed by the Add new segment button. The New segment form will be displayed.

Let’s start by applying a few most obvious segments that may help you uncover some usability issues in your funnel. Those segments will be:
- Mobile device users
- Desktop device users
- Users with Android devices
- Users with iOS mobile devices
Here you can find a short explanation on how to create each of those segments:
Mobile device users
To build a segment of mobile users, choose the following in segment criteria definition block:
Device type + is + Smartphone
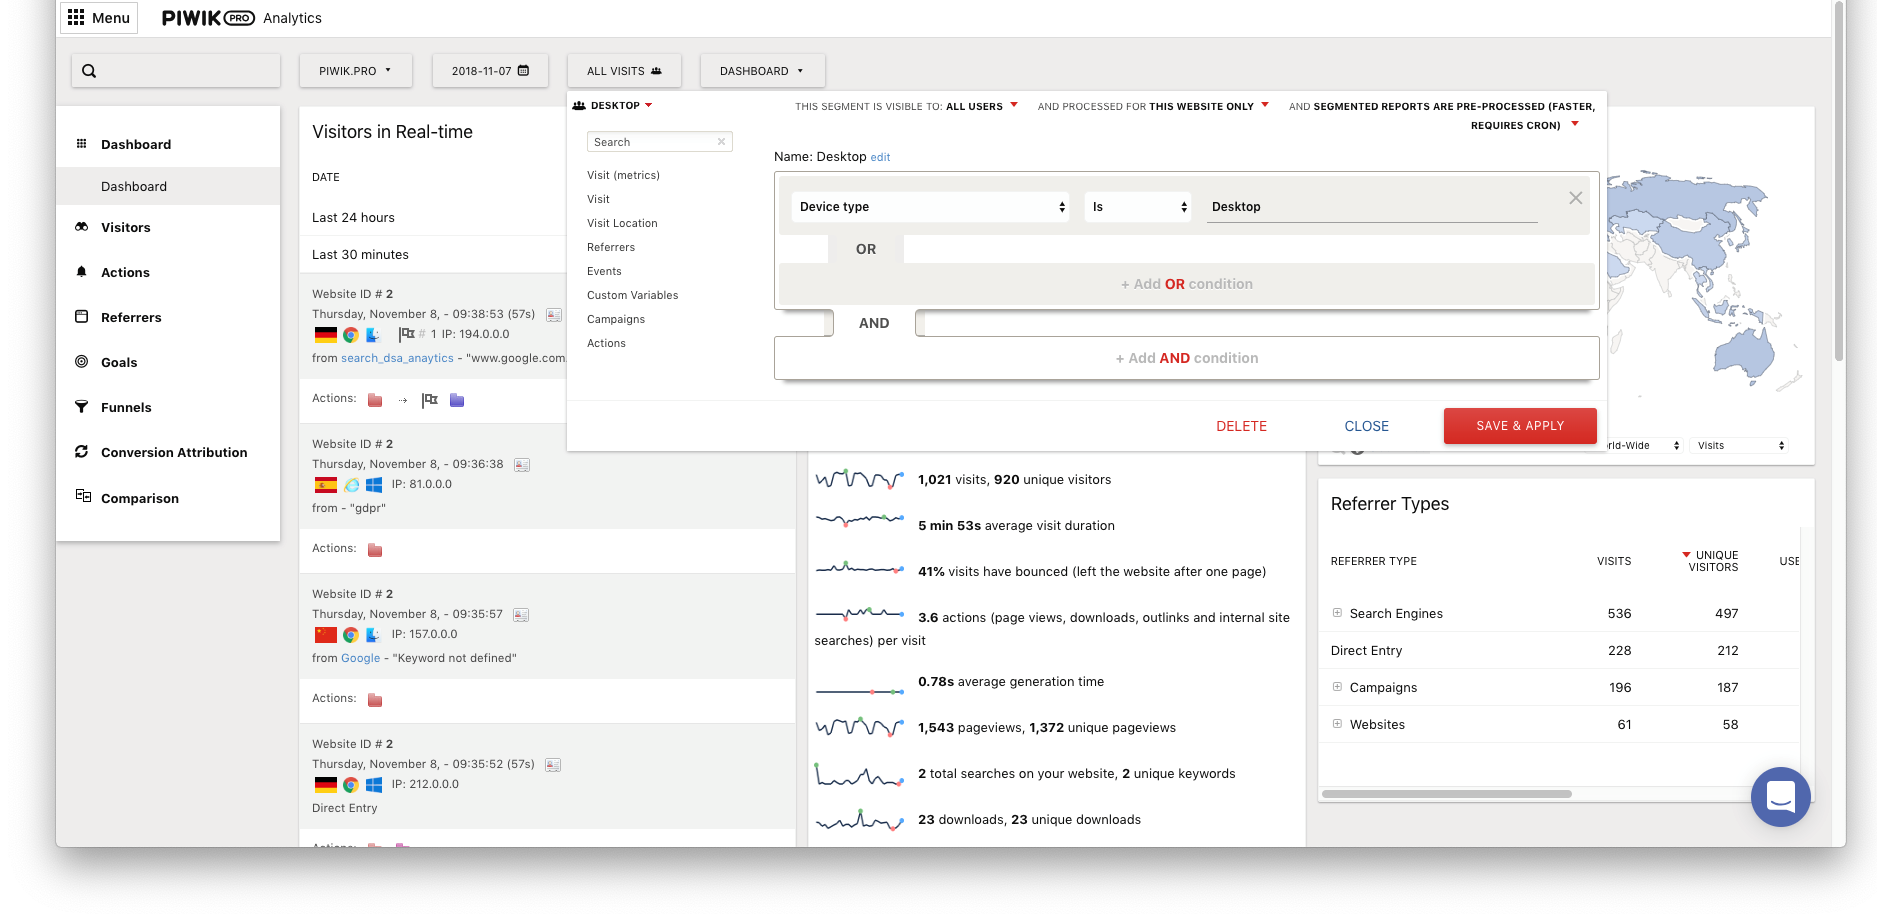
Desktop device users
When creating segments of desktop device users, use:
Device type + is + Desktop
Users with Android devices
In this case, choose:
Operating system + contains + Android
Psst! If you’d like to create a segment of users of particular version of software, let’s say Android 7.0, then you should define the following criteria:
Operating system + is + Android
Users with iOS mobile devices
Similarly as before, you choose the following configuration:
Operating system + contains + iOS
Still not sure how to go about segmenting your data? Then you should definitely get familiar with this user guide.
3) Examine your segments and see which one is causing the trouble
After all the segments are added (and saved!), it’s time to seek some answers.
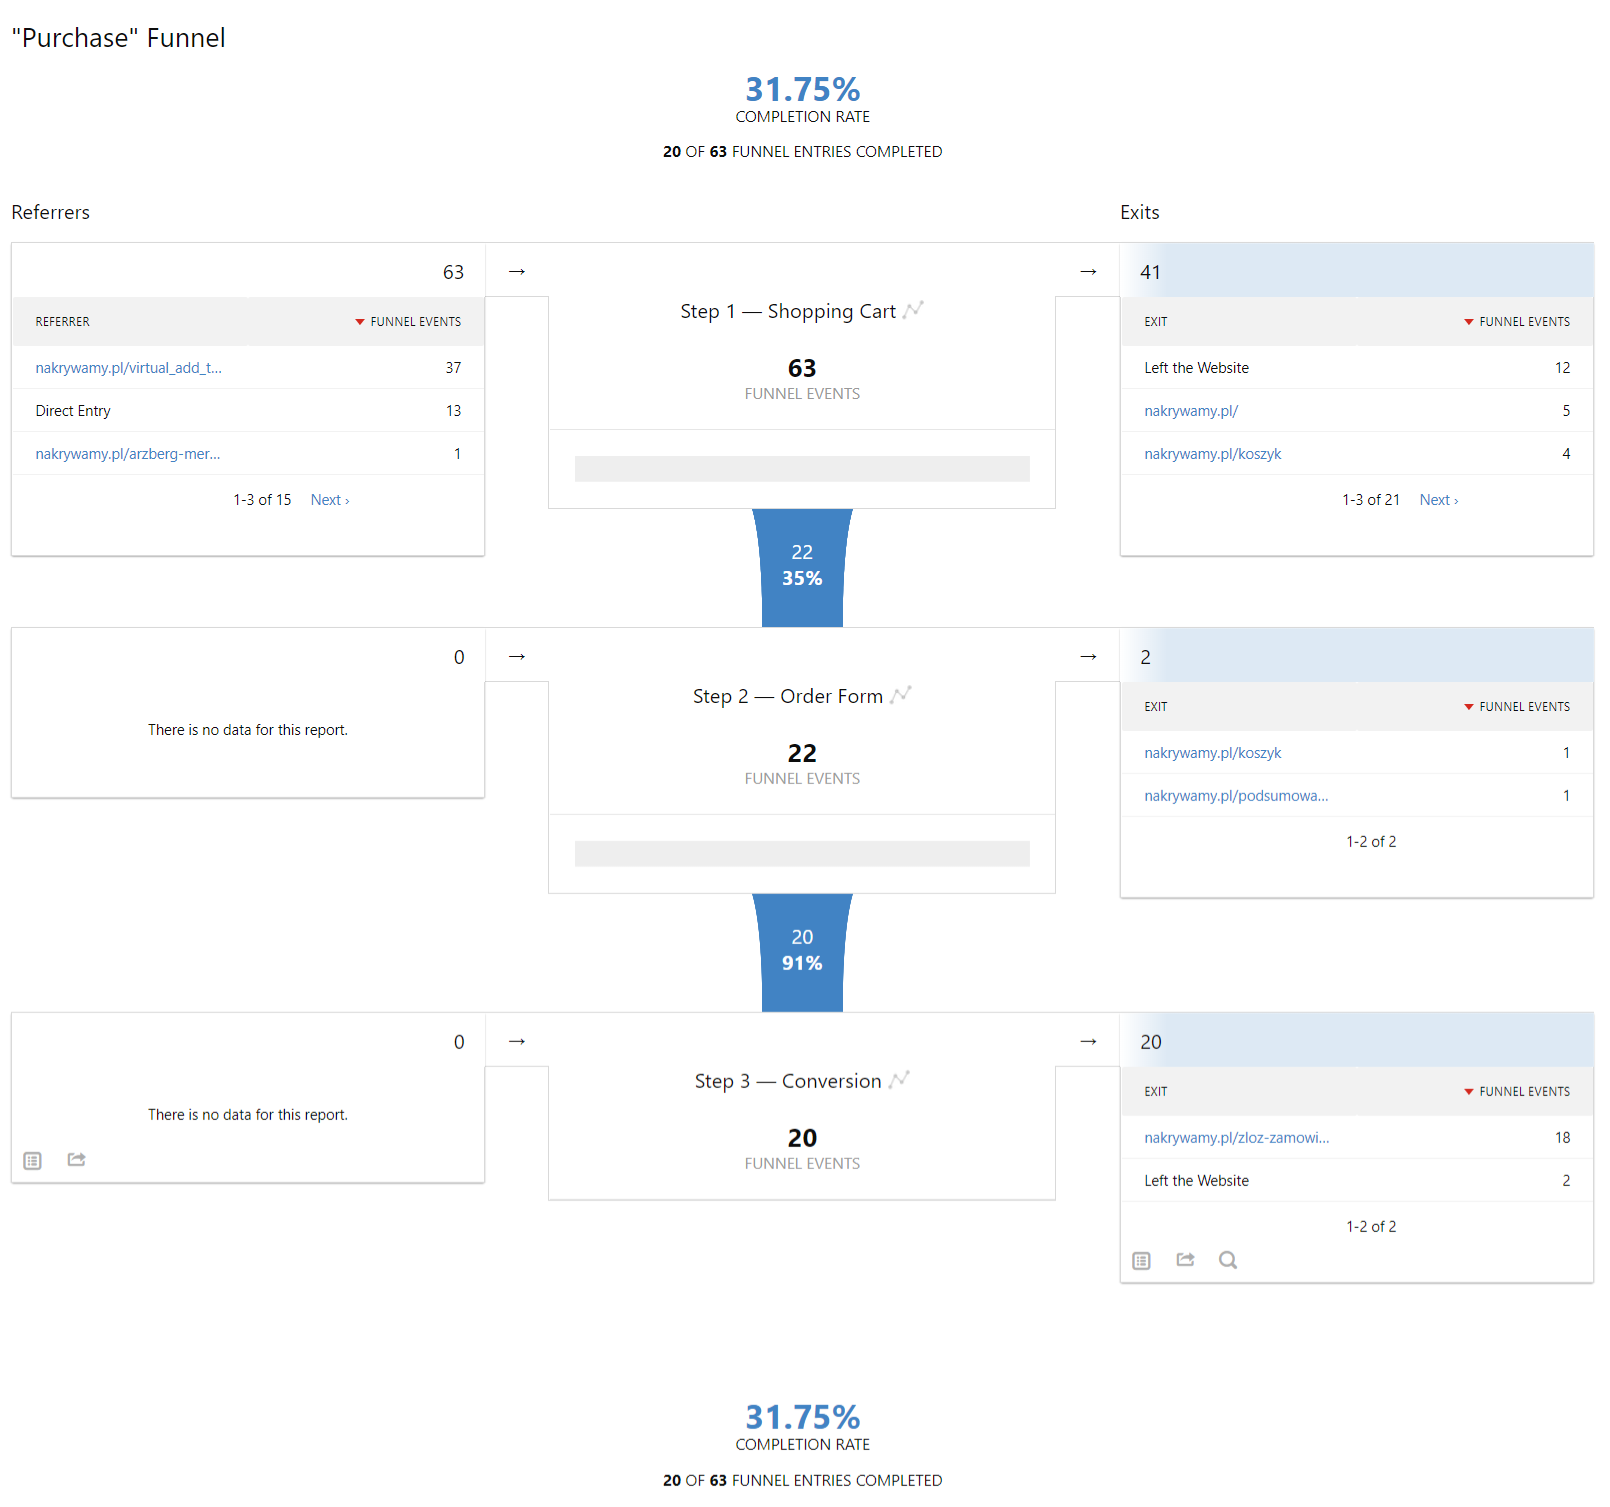
So here is how the funnel performs for the mobile users only:
A few things pop up instantly:
- Unsegmented funnel had an overall success rate of around 38%
- After applying “mobile users” segment, the funnel’s overall performance dropped to 24% which is a 36% drop in conversion
This looks quite alarming. Also, you may notice that this drop happens mainly at the shopping cart level. Could it be that your shopping cart is serving not mobile-friendly experience? That’s quite possible, but let’s not jump to hasty conclusions.
We’ll get back to this later on, but first let’s see how the funnel performance differs for the desktop users.
Here is how the funnel performs for the desktop users only:
Seems like the experience on desktop devices is generally much better than in the case of mobile users, since:
- Overall funnel performance jumps from 38% to 45%, which is a 15% lift
- Step 1 – Cart success rate jumps from 42% to 50%, which is a 19% lift
- Step 2 –- Order form success rate jumps from 88% to 90%, which is a 2% lift
Free Comparison of 5 Leading Web Analytics Vendors
Compare 40 Variables of 5 Leading Enterprise-Ready Web Analytics Vendors:
You could settle with the finding above and conclude that the funnel is not well suited for mobile devices. But instead of ending your investigation right away, it’s better to go the extra mile:
4) Break down your segments into even smaller pieces
Whenever you find underperforming segments, you should drill down further and break these segments into even smaller pieces to get to the bottom of the issue. In the case of mobile devices, the smaller pieces will be specific OS types – namely Android Mobile Devices vs iOS Mobile Devices.
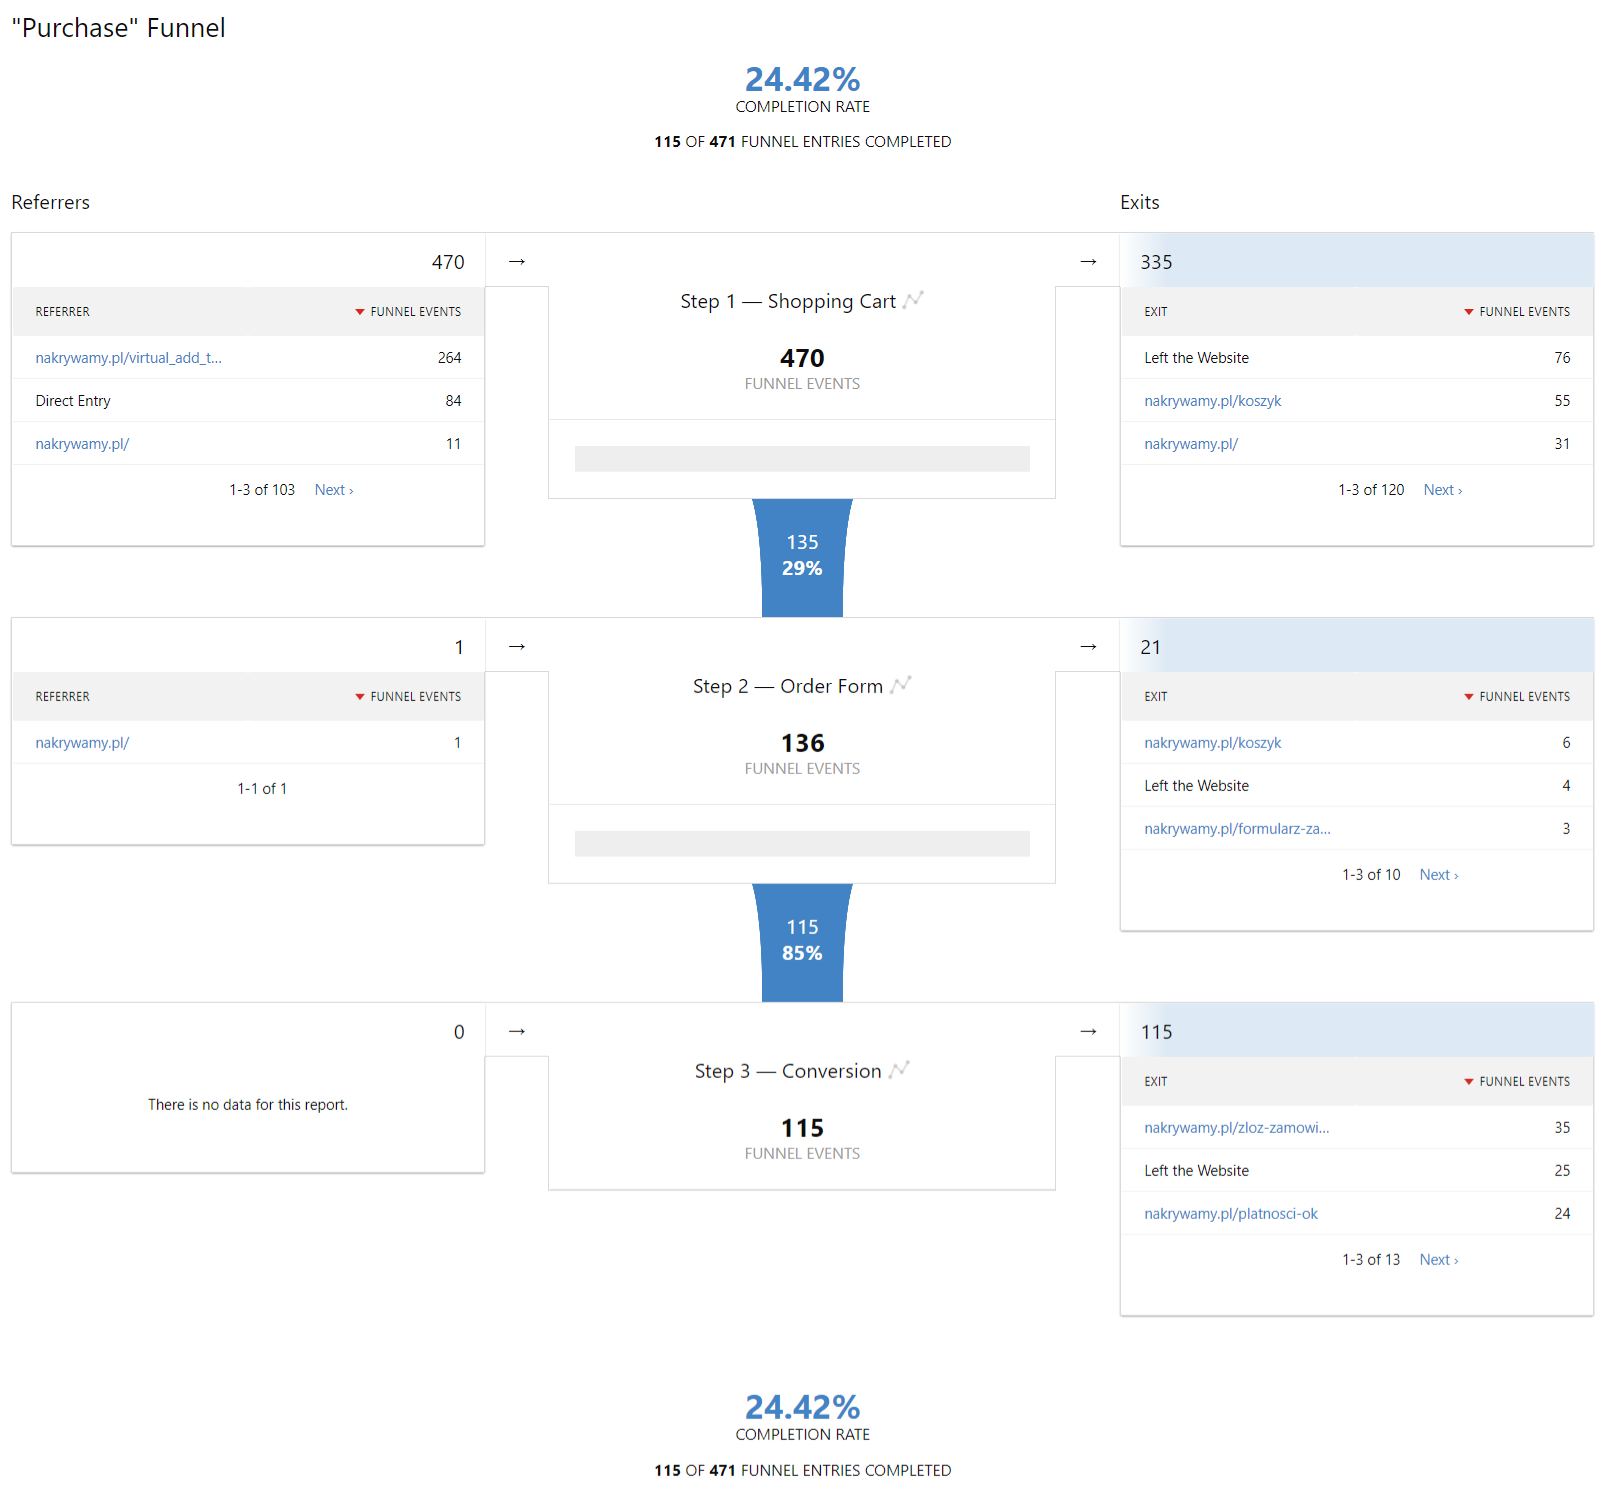
Here is funnel performance for the Android users only:
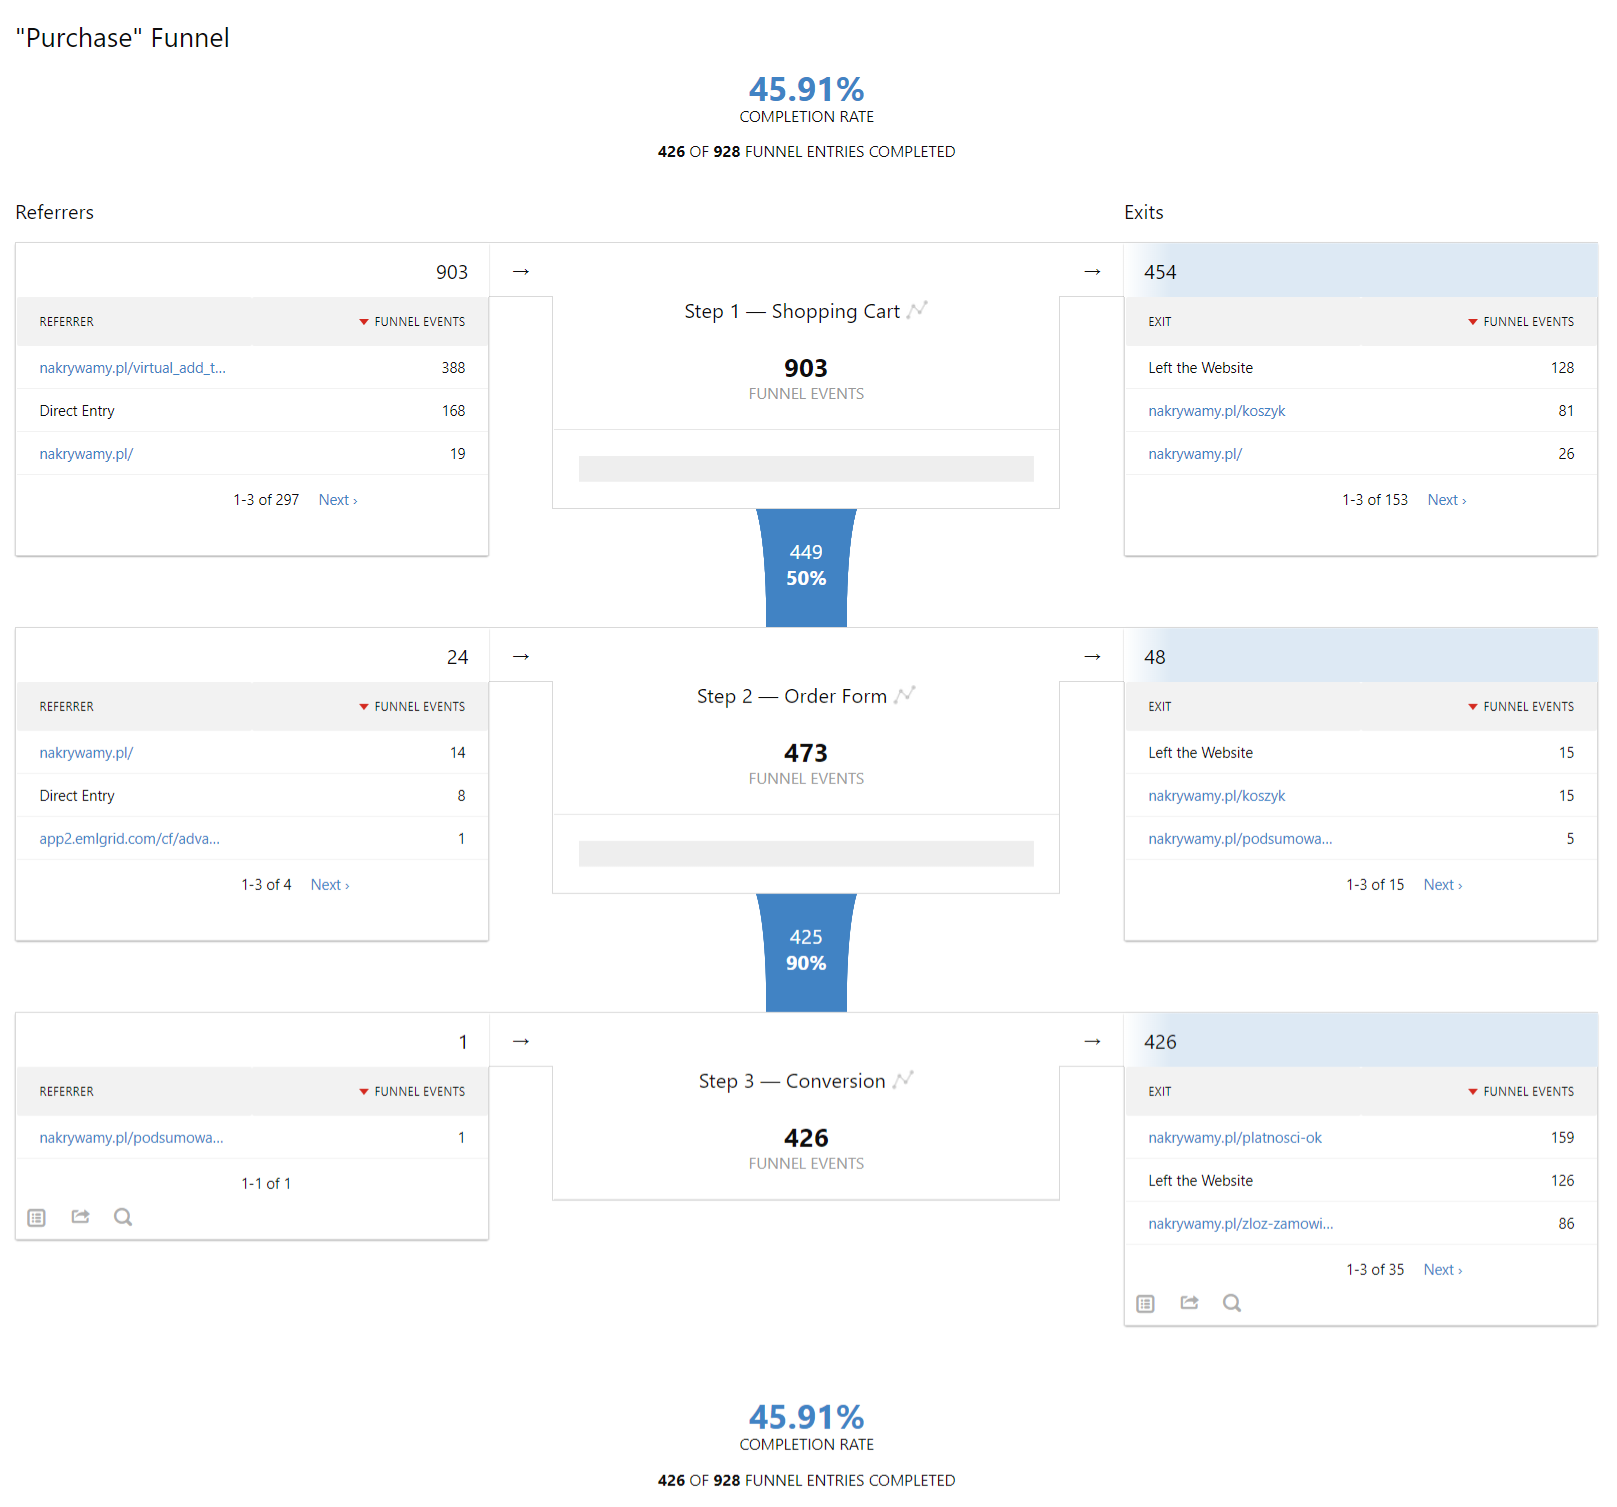
And here is the performance of the same funnel for the iOS users:
A comparison of the Android iOS users microsegments allows to conclude that:
- iOS users convert slightly better than Android users (24% vs 31% funnel performance)
- The biggest difference is at the shopping cart level where iOS users have 35% success rate (in the case of Android it’s 29%)
- The differences between Android users and iOS users aren’t that big and maybe not even statistically significant but it’s definitely a clue worth following
So what next? How to make those insights actionable?
5) Confirm your findings and test out solutions for the problem
As a result of the analysis you’ve found potential funnel bottlenecks (shopping cart and order forms) and potential reasons for the lower conversion rate (cross-device problems, poor experience for mobile users).
The next logical step is to confirm those findings with cross-device functional testing, user testing and heuristic walkthrough. All the insights can later on fuel the A/B testing hypothesis creation and other conversion optimization activities.
If you want to read some more tips on optimizing your conversion rate using analytics, be sure to check this blog posts out:
Conclusion
Funnel analytics is without a doubt one of the most useful tools to measure and map the customer journey of your visitors. However, with a little help of segmentation, your funnel analytics reports will become filled with much more actionable insights on what to fix in order to ensure an undisturbed user flow between each step in the customer journey.
If you have some more questions about the configuration or characteristics of each feature, don’t hesitate to contact us. We’d love to dispel any of your doubts!