
A new month and a new Piwik PRO. We’re proud to announce that our Analytics Suite 9.0.0 is ready for blast off, loaded with upgrades and more powerful than ever before. On July 11, our customers will be able to see for themselves the effects of new enhancements and fixes. We’ve gone the extra mile to make the road to your analytics goals even smoother.
To make sure you get every detail of the latest rollout, here’s the whole story.
Welcome to More Capable and Flexible Analytics
Among the numerous improvements to the platform, pride of place goes to the new Analytics module. Let’s go step by step through the key functions and features, both new and upgraded ones:
Here’s what you can expect from the refreshed Analytics module:
- New powerful Interactive Dashboards:
- Customizable widgets for individual KPI/metrics
- Intuitive drag and drop interface
- Advanced filters for dashboards and individual widgets
- Real-time segmentation of dashboards
- Enhanced reporting quality with customization and increased flexibility
- Simple and convenient comparison of segments and date periods
- Must-track website performance metrics and reports (RUM – Real User Monitoring)
- Robust Google Search Console integration
Most importantly, you’ll be able to customize almost every aspect of reporting in the new Piwik PRO, whether it’s a default report, dashboard, or a widget. Adding, removing, and editing metrics, dimensions, columns, or even whole charts will take just a few clicks.
That means you’ll get more out of your data and see the bigger picture quicker and easier than ever before.
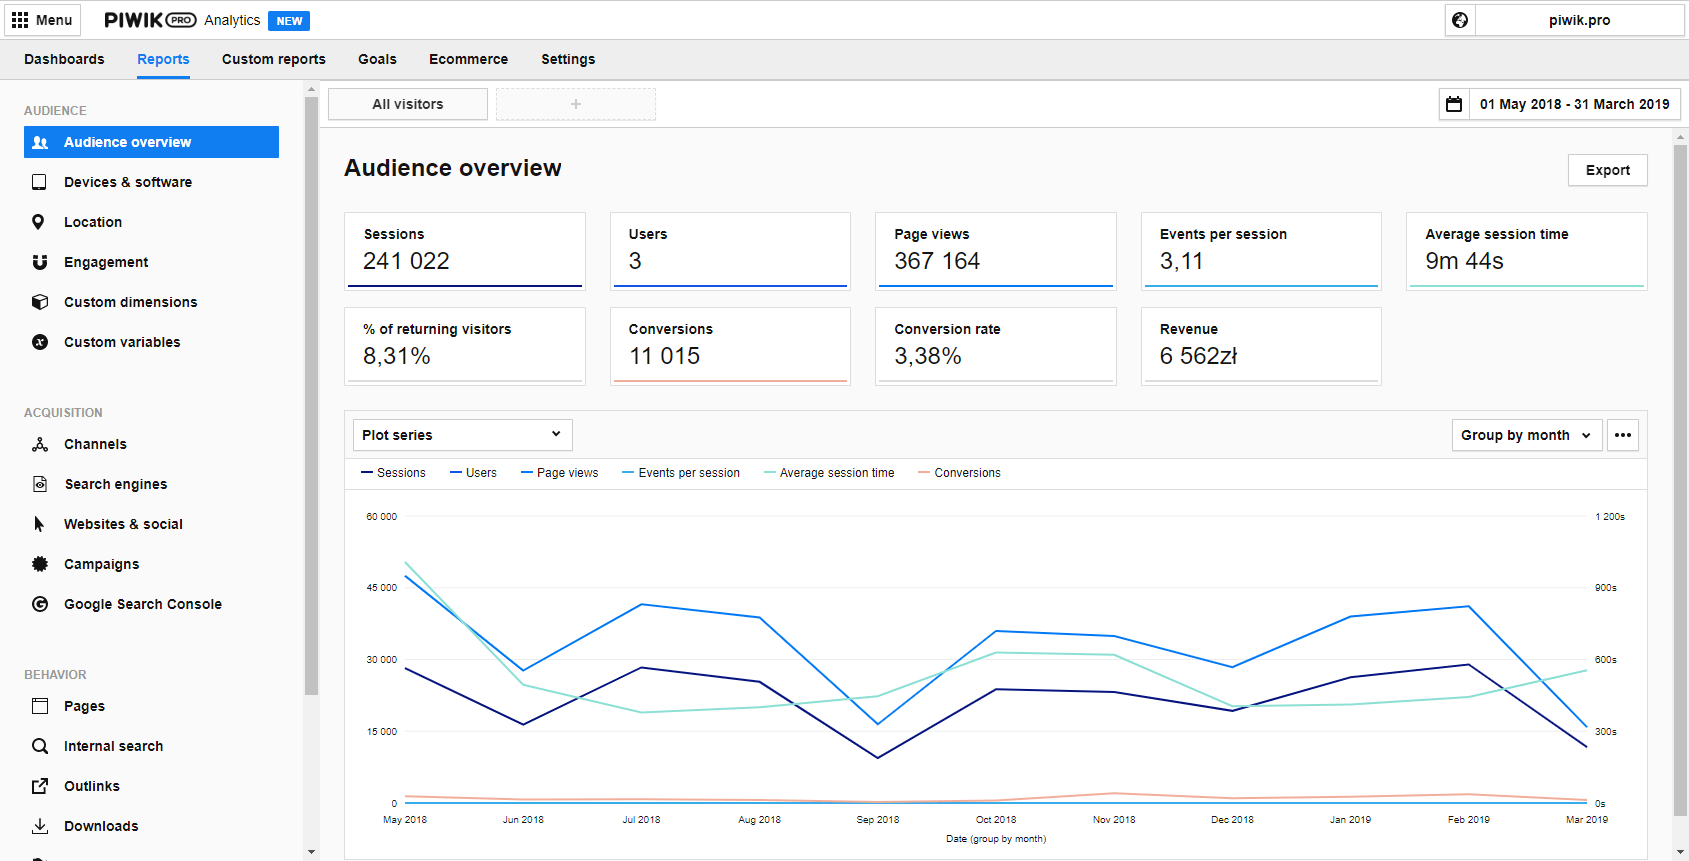
1. New Powerful Interactive Dashboards
The new Piwik PRO makes grasping the story your data is telling about your business effortless. We’re talking about dashboards, collections of widgets to visualize data. They provide an overview of your business analytics metrics, KPIs, and important data points, all presented on one screen.
With enhanced Piwik PRO dashboards your data will tell its story without any extra visualization tools, whether it’s Looker Studio (former Google Data Studio) or Excel dashboards.
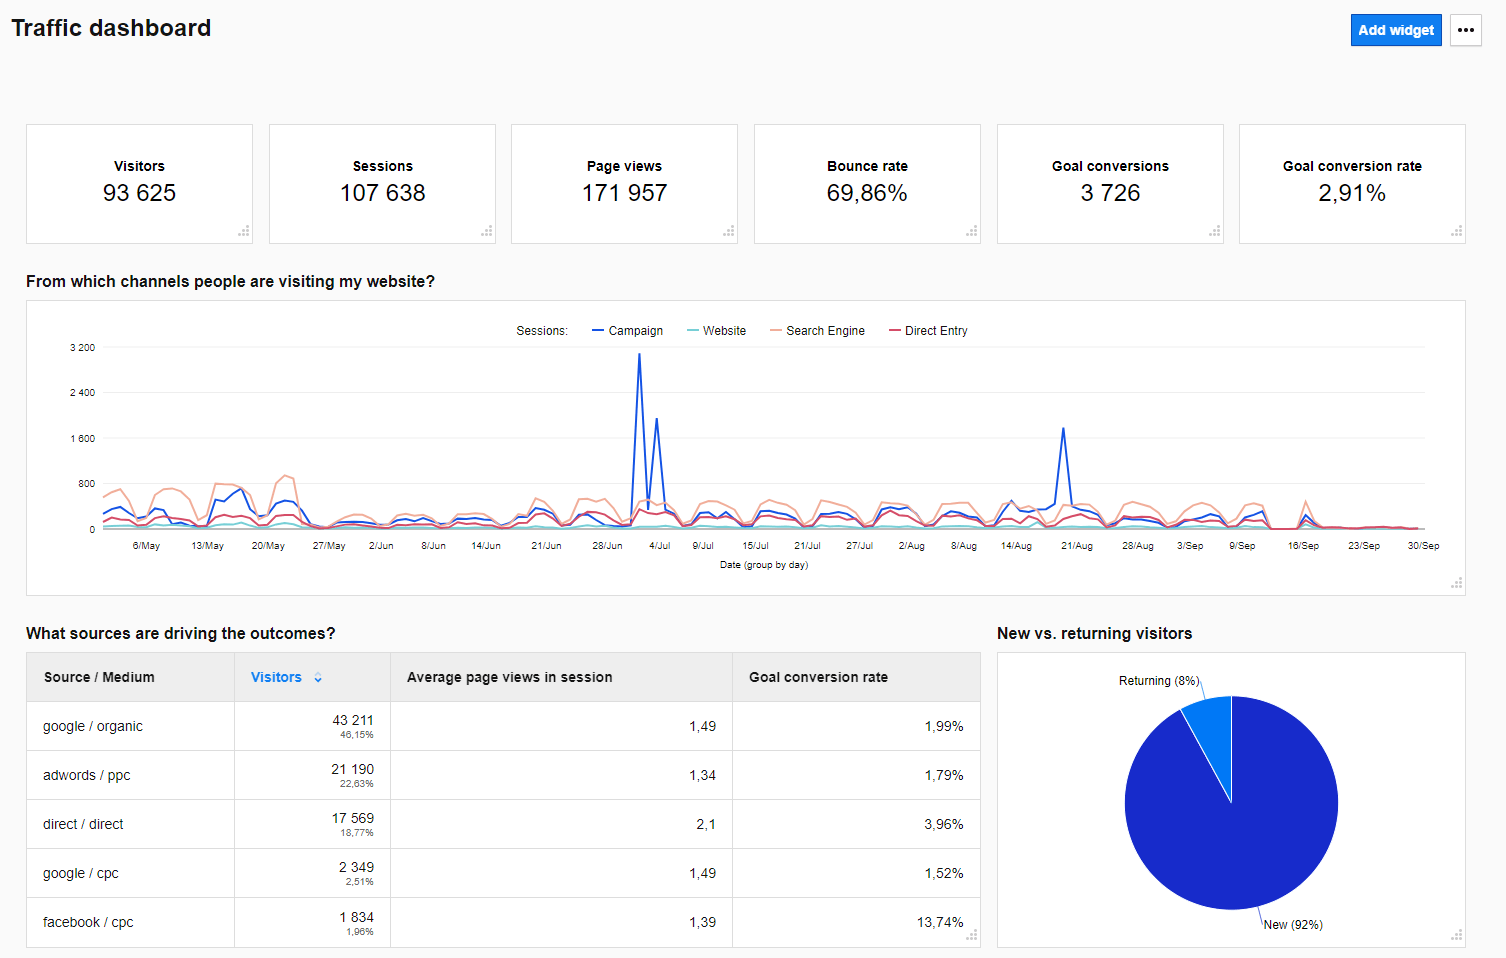
You can compare multiple reports on a single page in visual formats – tables, graphs, charts – for better performance tracking and metrics, whenever and wherever you are.
What’s more, Piwik PRO lets you apply individual metrics as separate widgets on your dashboards to highlight KPIs crucial for your business. On top of that, you can create individual dashboards to keep private, or you can share them with selected people in the organization.
You can also narrow down the KPIs displayed on the dashboard to a certain audience or filter out traffic for a particular KPI. Just attach a filter or segment to each metric you want to have on the dashboard and it’s done.
Moreover, you get the freedom to easily design dashboard layouts according to your specific needs. Even if you just want to resize one widget, you’re in charge.
Making better use of Metrics and KPIs widgets
You can take advantage of custom charts and tables by applying custom metrics and dimensions. This makes your dashboards more efficient and fully aligned with your business strategy.
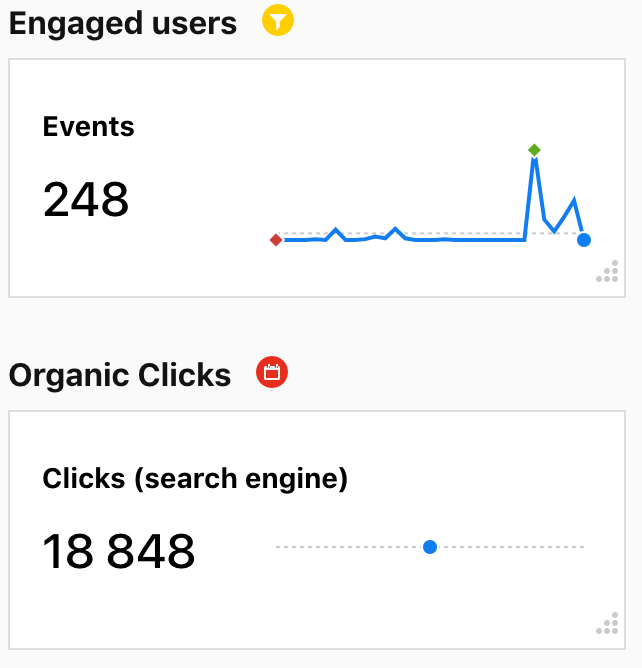
What’s more, widgets are also customizable and you can expand them along the desired timeline to visualize how your KPIs change over time.
Customizable analytics dashboards with broad possibilities to apply the metrics and KPIs widgets of your choosing make reviewing your data easy, which drives more effective actions.
2. Benefit from enhanced reporting
As we’ve already mentioned, advancements in reporting functionality allow you to customize almost every element of Piwik PRO reports. Never get stuck with a default setup! Just add or remove analytics bits and pieces as your needs change. That’s real flexibility.
Each report has a “Customize” button as a handy way to apply changes.
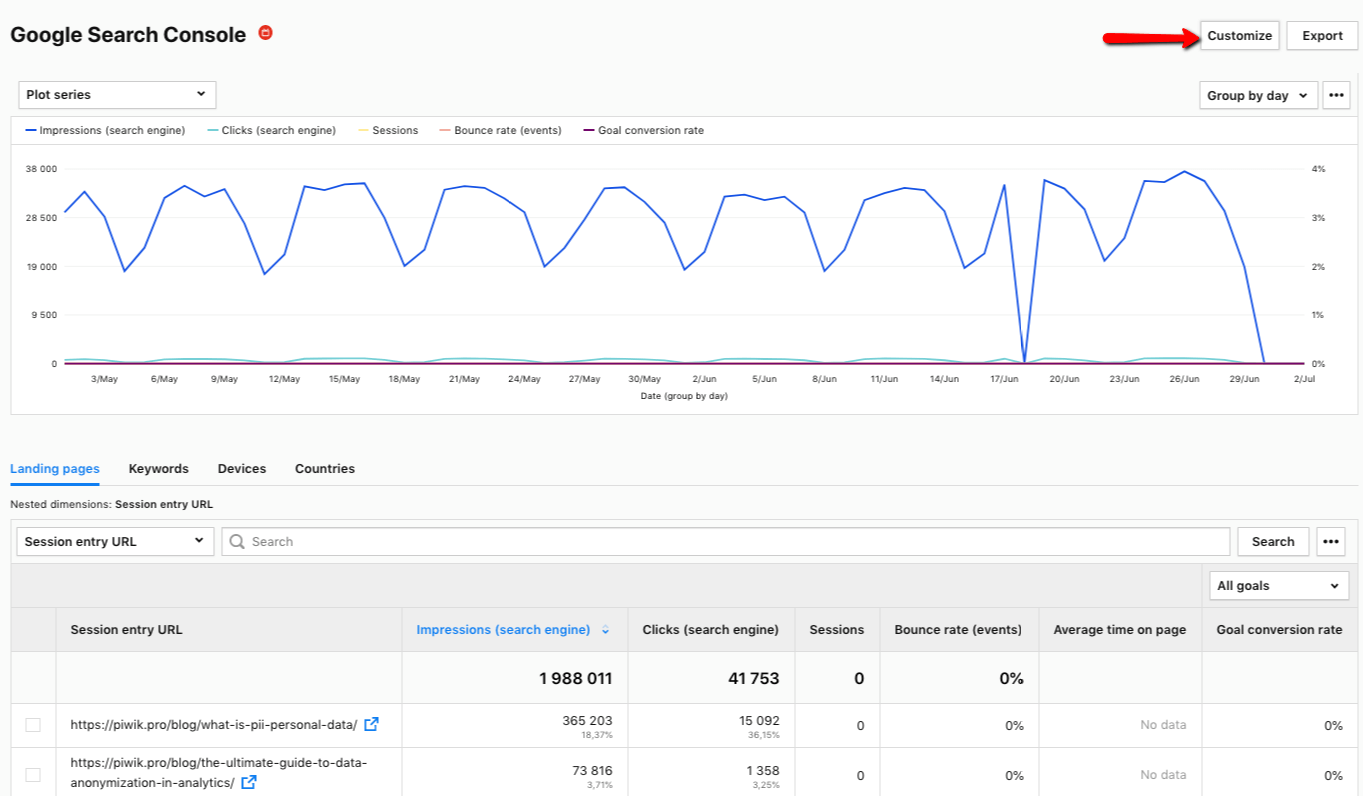
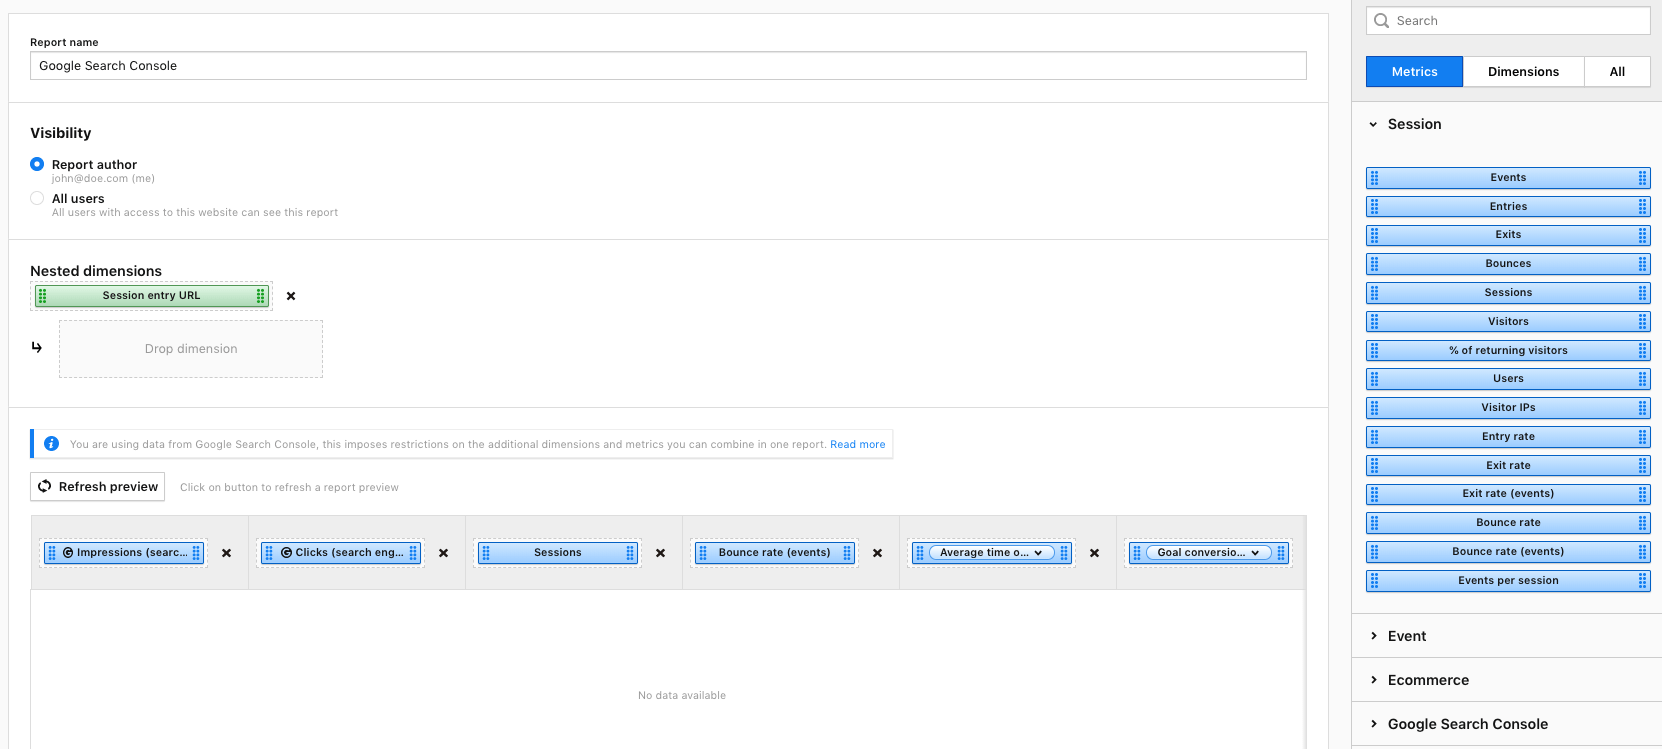
Once you’ve activated the wizard, you can easily customize your reports by filtering out traffic or just using segmentation. These filters and segments will be visible each time you use this report, so you won’t have to set them up again.
Most importantly, you can reshape every default report and adjust it to your exact preferences. Add or remove KPIs according to your specific business needs and change the report at any time to help particular departments or teams.
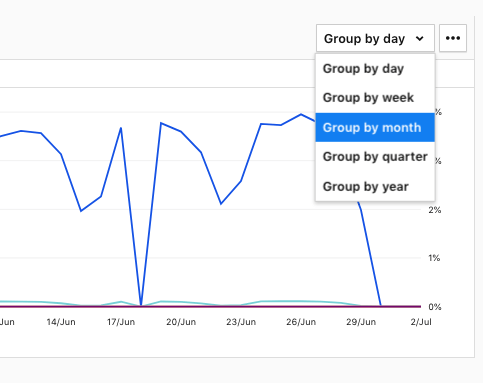
What’s more, you can change the period for which data is grouped on each chart. This is crucial in discovering seasonality and spotting trends across extended time frames like weeks, months, quarters or years.
Last but not least, additional flexibility comes with the Comparison feature. There’s a lot to discuss in this feature, so in the next section we’ll go into some detail about it.
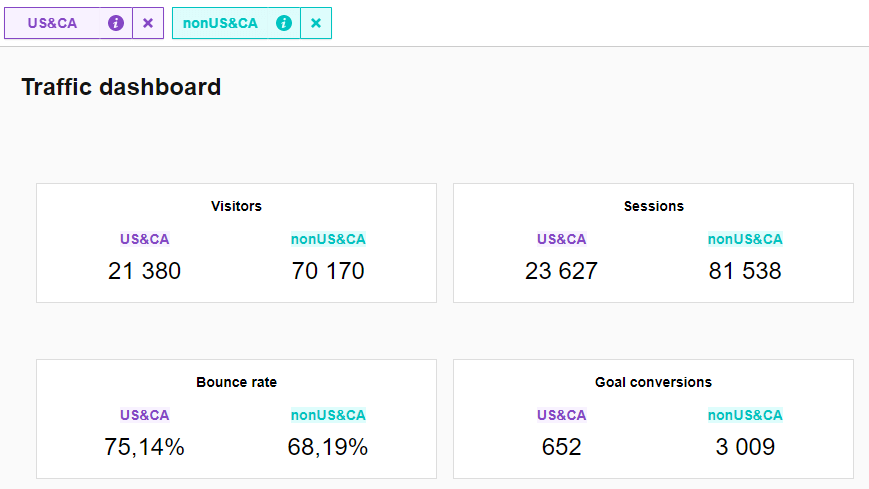
3. Take advantage of Comparisons
The new Piwik PRO Analytics delivers a Comparison feature.
Properly measuring and reporting on your site’s progress requires comparisons across various date ranges. Once you contrast equivalent time periods over the years, you can spot some important trends or simply verify how your business is doing compared to the previous year or season.
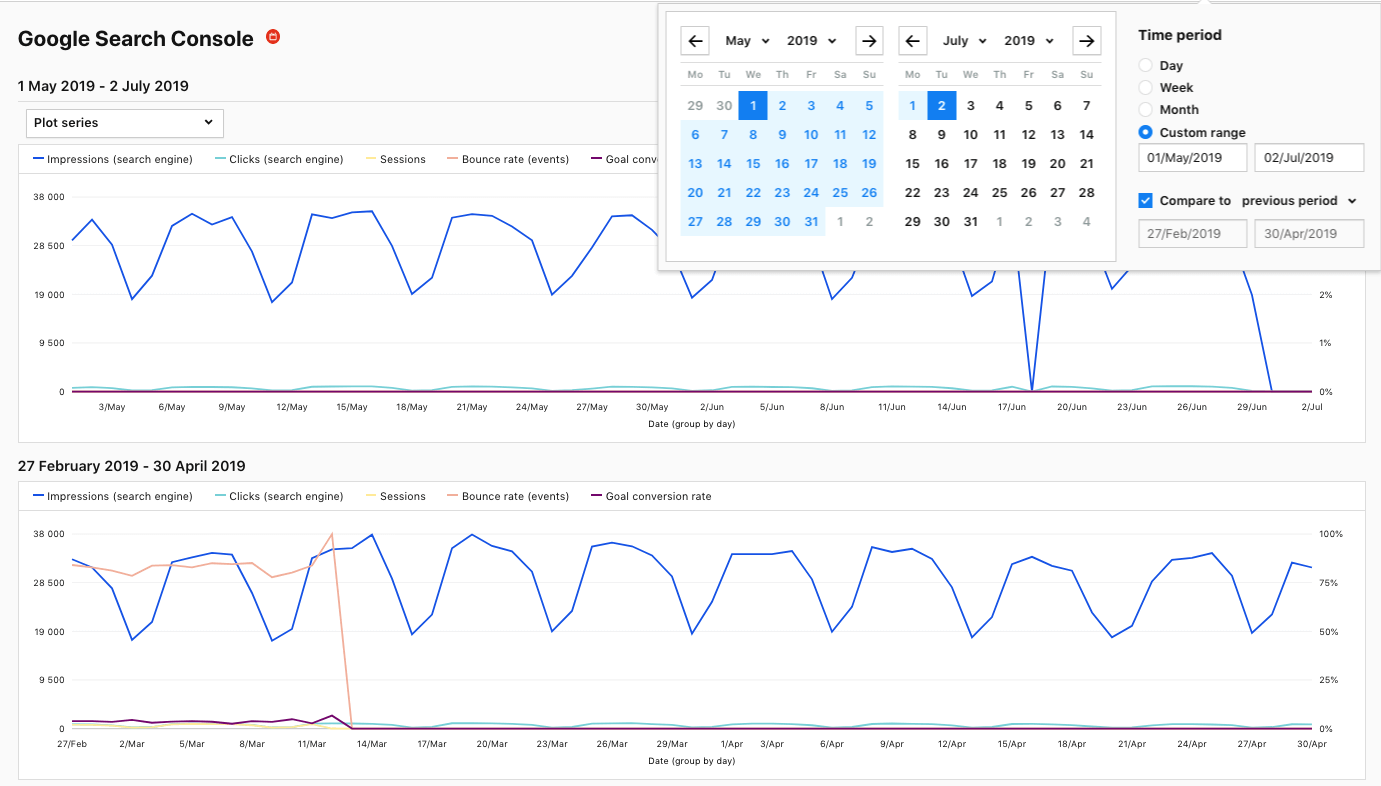
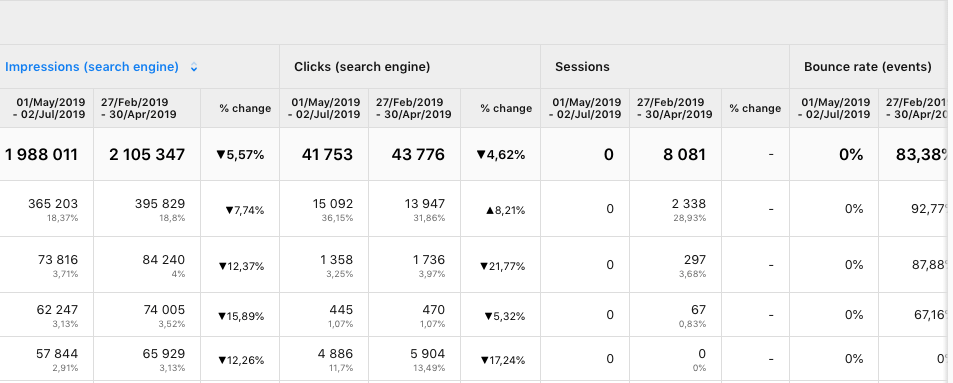
Thanks to the Comparison feature, available also at the chart and metrics level, you can put the values of your KPIs for the given time periods side by side and see the difference in percentage terms. And you will know exactly how the value of your KPIs over those two periods differs.
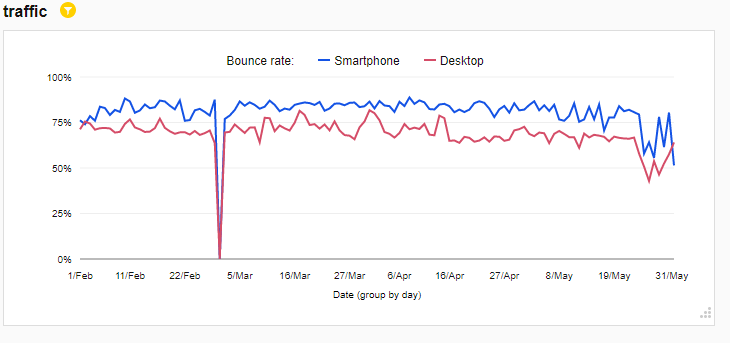
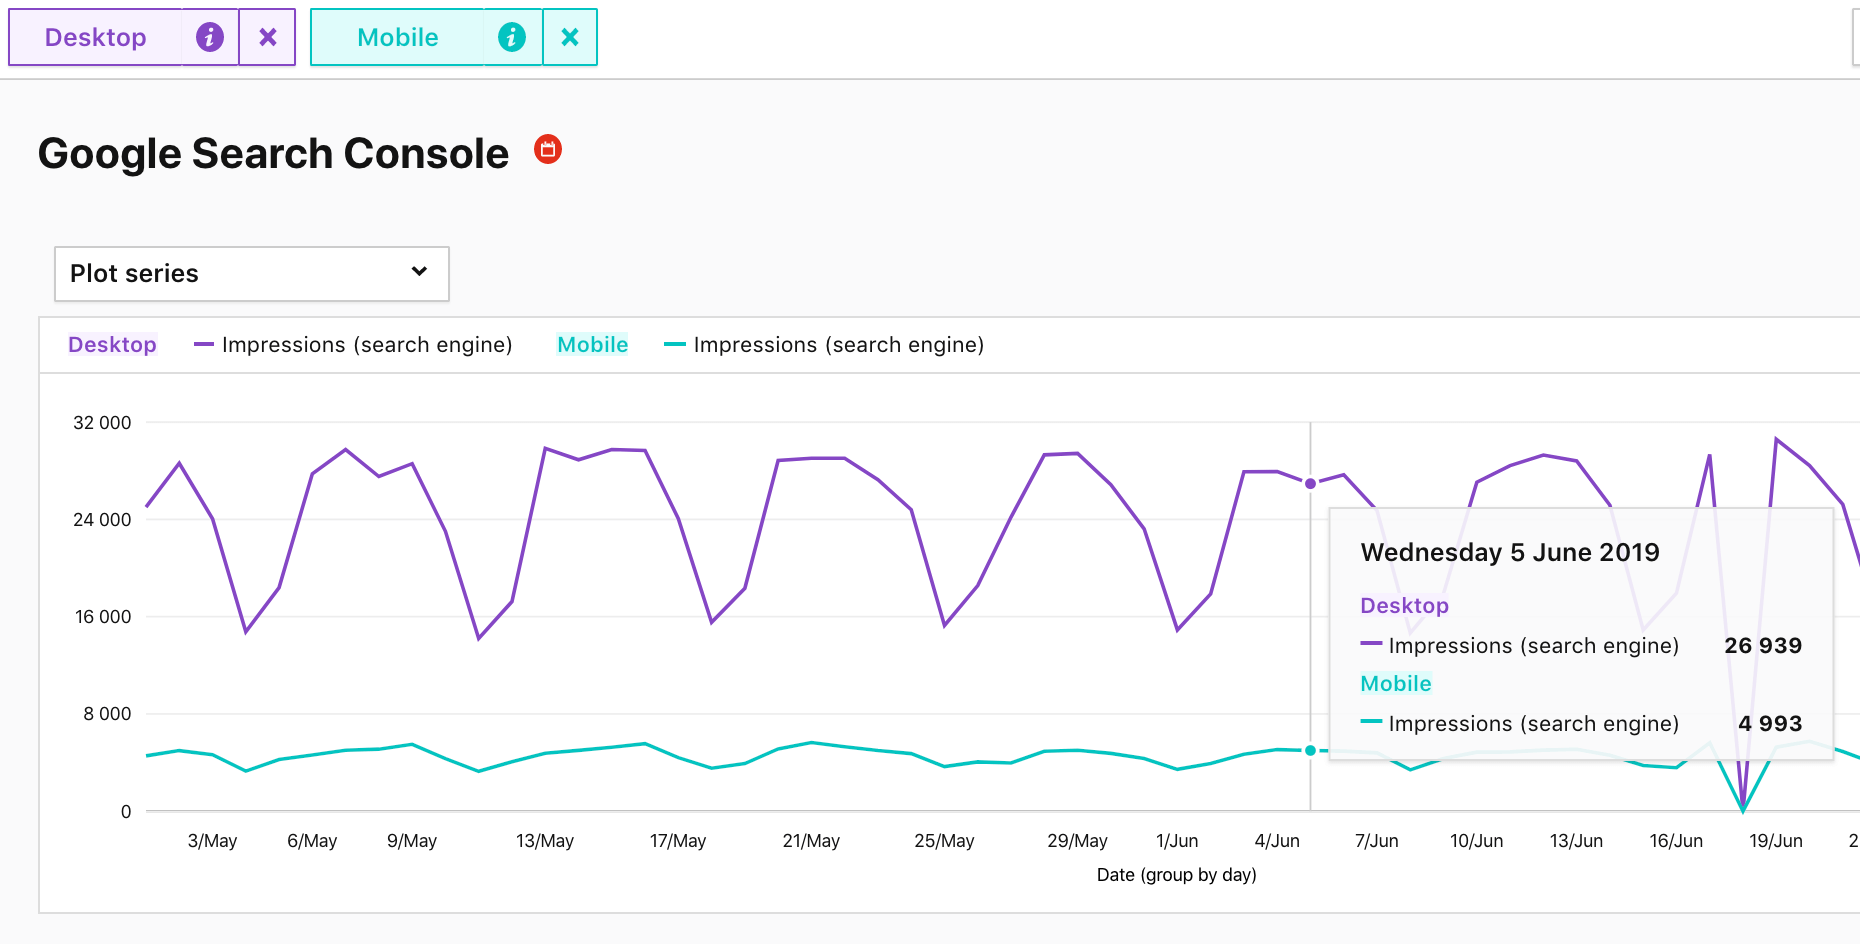
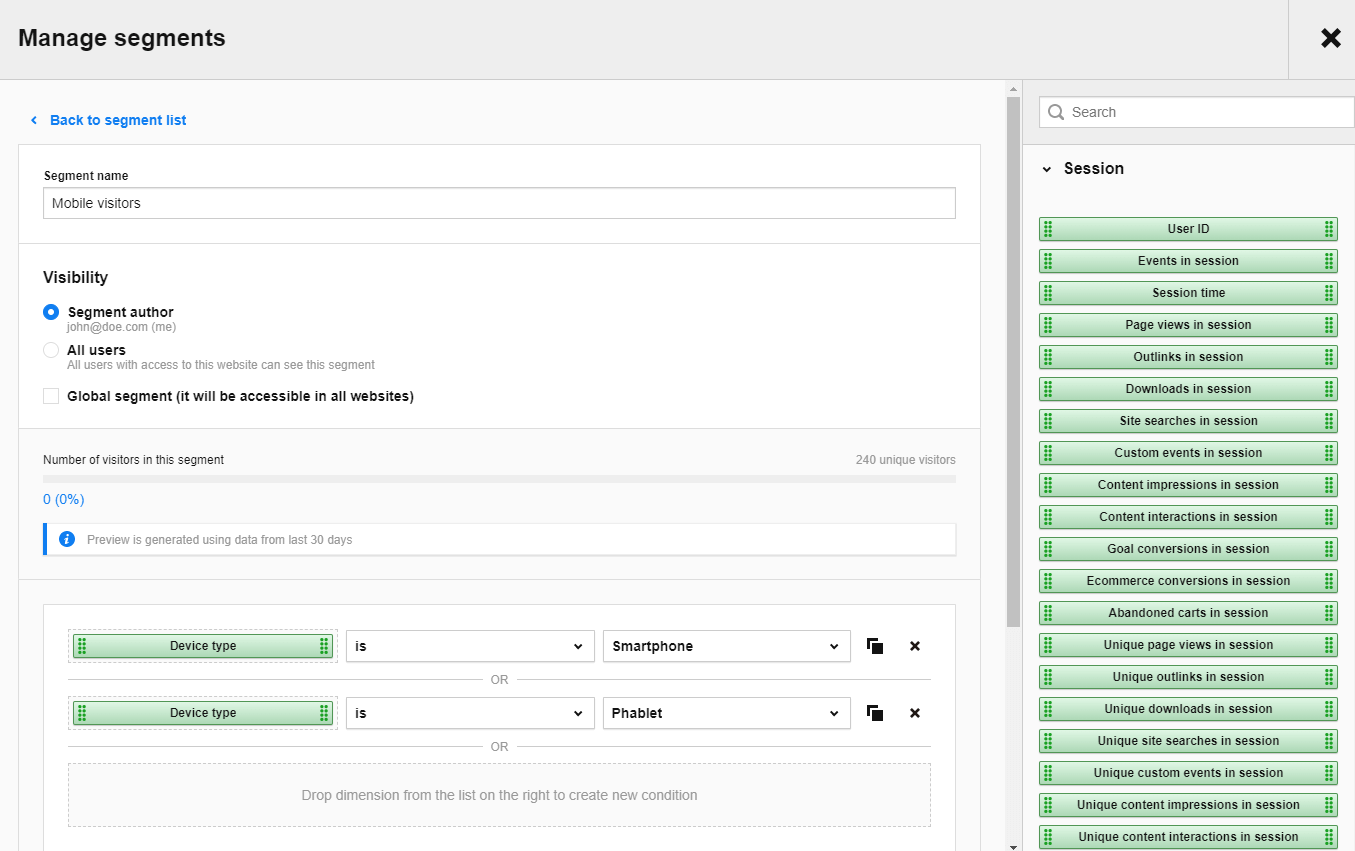
What’s more, you can directly compare segments from each report in Piwik PRO. For instance, you can simultaneously apply a segment for mobile users and a segment for desktop users.
The report you’re reviewing will split into two sections, letting you contrast data from these two segments in a clear and informative way. That’s your recipe for discovering behavioral differences, trends and similarities across segments.
4. See your data, reports and segments in real-time
We’ve made performance and reliability of your analytics data the top priority in this new release. There’s no more archiving, no more delays – say farewell to segments needing 24 hours to be refreshed.
Now all your data, segments and reports are available on the fly. That’s because Piwik PRO Analytics’s backend is powered by ClickHouse, a column-oriented database management system generating reports in real-time.
This means that you can now create advanced segments capturing up to 500 million actions in real-time, without sitting around waiting for archiving to be finished. Also, you can quickly edit your existing segments without waiting hours for changes to take effect.
That’s crucial for your business strategy, as you can do instant analysis and answer burning questions with the right data, delivering immediate answers to stakeholders.
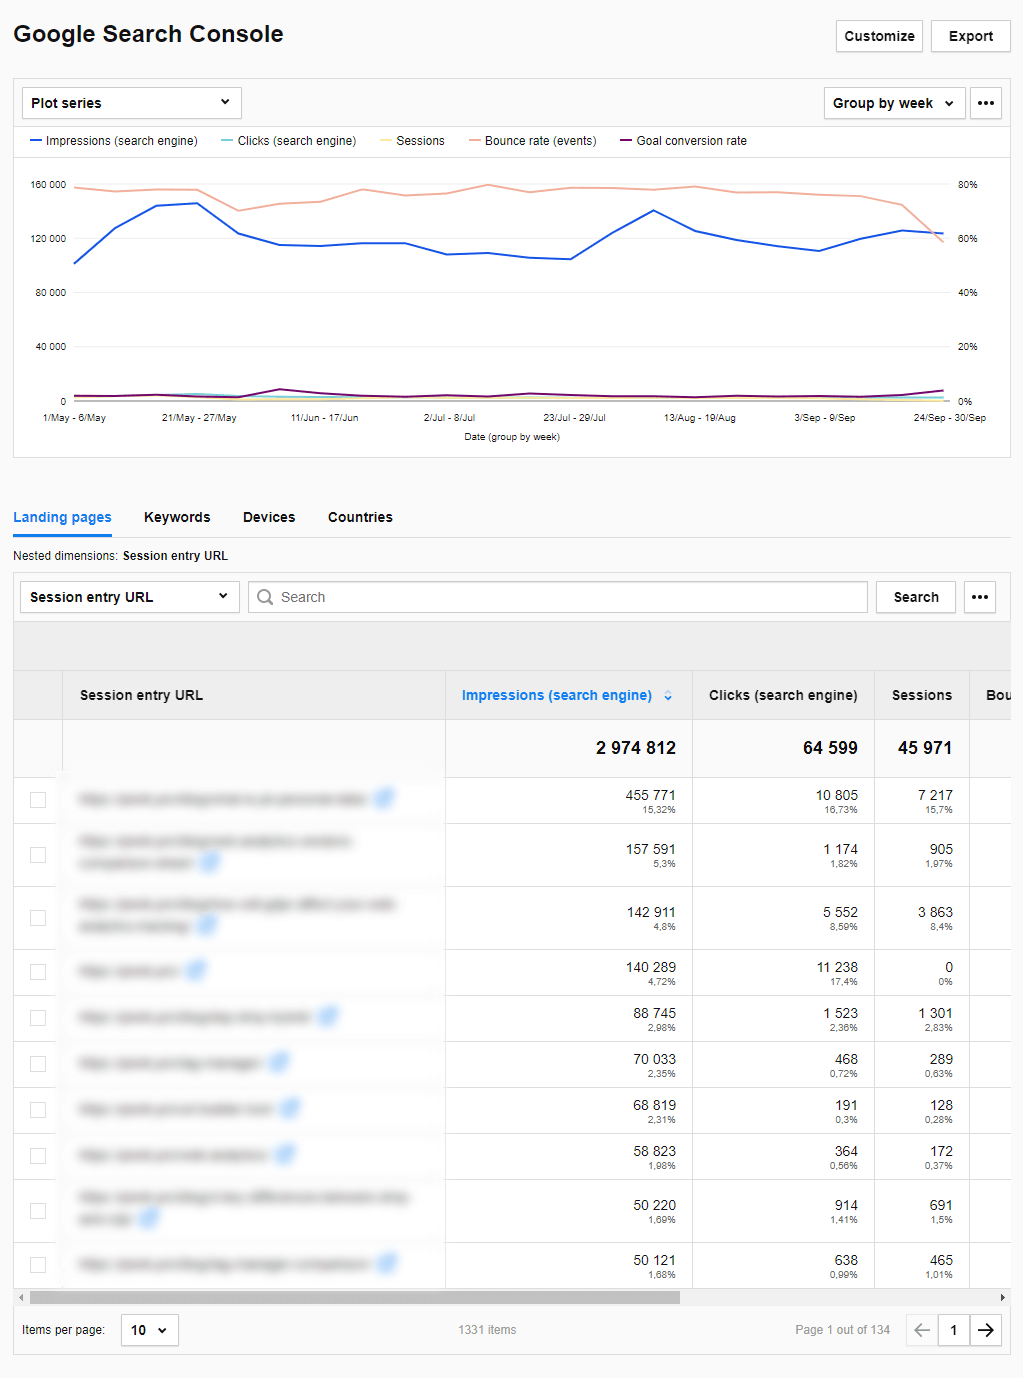
5. Make use of Google Search Console integration
The horrible “data not provided” notice in Search Engines keywords reports is a thing of the past. All credit goes to the integration with Google Search Console (previously Google Webmaster Tools) included in the recent release.
This has also built up Piwik PRO’s metrics library with:
- Impressions – for keywords searched on Google
- Clicks – for keywords
- CTR – ratio of impressions to clicks for keywords
- the average position of the keyword in the Google search results over a given period
Your analytics data will now be expanded with additional measures from the integration.
You can apply Google Search Console metrics for your dashboards, segments, and both custom and default reports.
Of note, you can segment every data point from GSC reports using the wide range of dimensions available in Piwik PRO.
Marketers and SEO specialists will be armed with Piwik PRO behavioral data and Google Search Console data to engage in content and on-site SEO optimization initiatives.
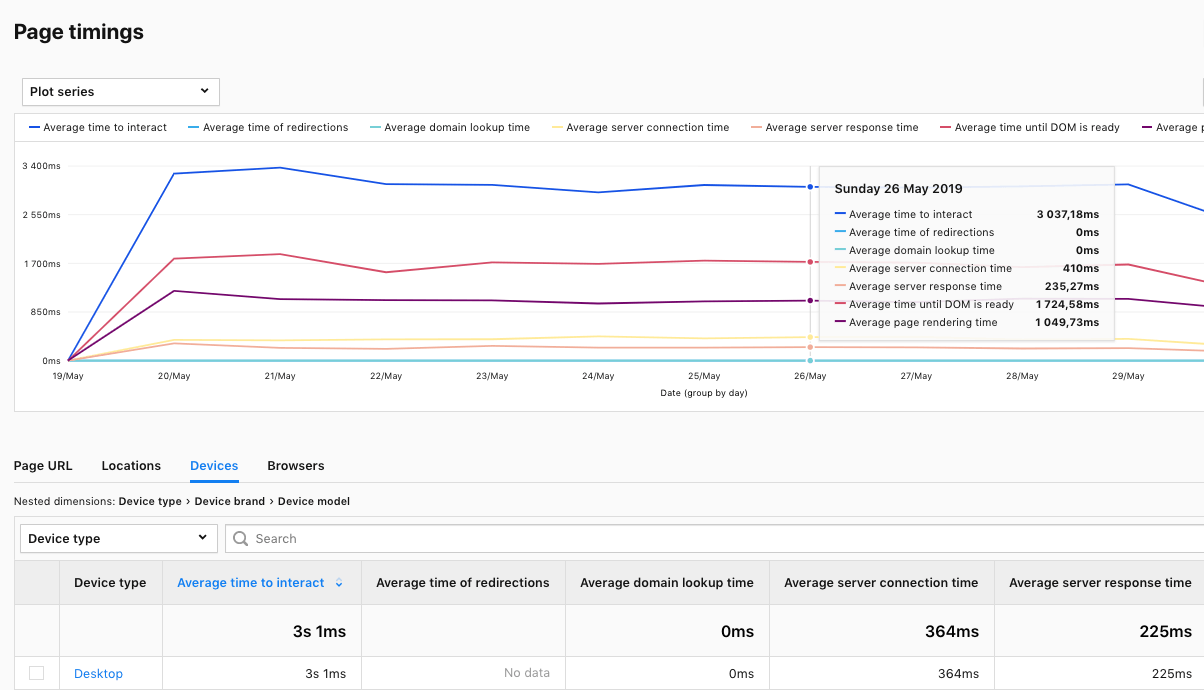
6. Optimize your website speed with the brand-new Page Performance Metrics
Providing an excellent user experience is about finding every place where friction occurs and fixing it on the spot.
To help you with this task, we’ve beefed up Piwik PRO Analytics with a ton of page performance metrics and default reports based on them. These give comprehensive measurements of website and app load times across devices, browsers, users and segments.
This information helps developers and product teams to optimize your site, particularly for page load speeds. You’ll be able to better reach mobile users and those with slower connections.
Here’s a list of the key metrics for understanding page load speed:
- Time until page is loaded
- Time to interact
- Time until DOM is ready
- Time to first bite
- Latency
Finally, page performance metrics and reports come handy not only for discovering technical and performance issues on websites and apps, but also for conversion optimization and SEO.
7. See what’s new with other Piwik PRO products
We’ve talked about the big deal that is Piwik PRO Analytics, now it’s time for some smaller but important updates to our other products.
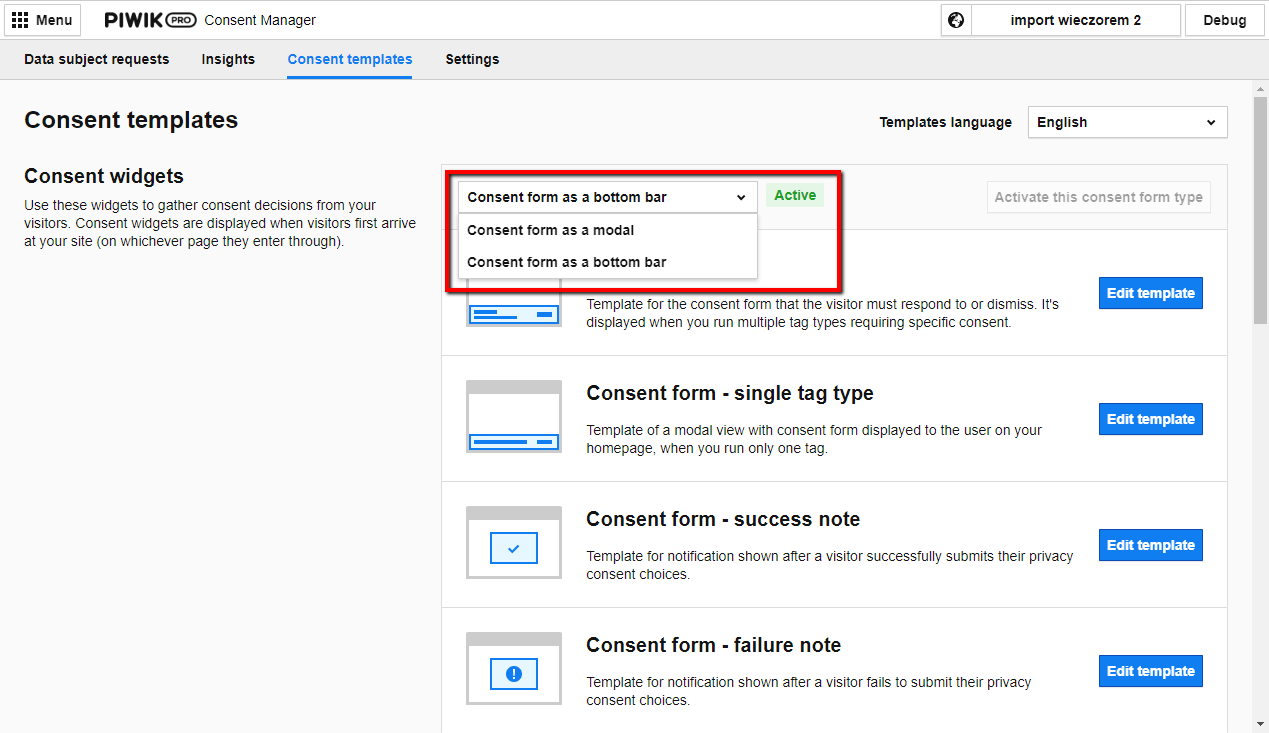
- Consent Manager has a new template for messages, and now you can choose between a modal or a new bottom bar. Expanded options make it easier for you to collect consents in a more user-friendly way.
- In the newest update we’ve included some improvements to Tag Manager. These involve fixes to some trigger bugs and support for nested script tags.
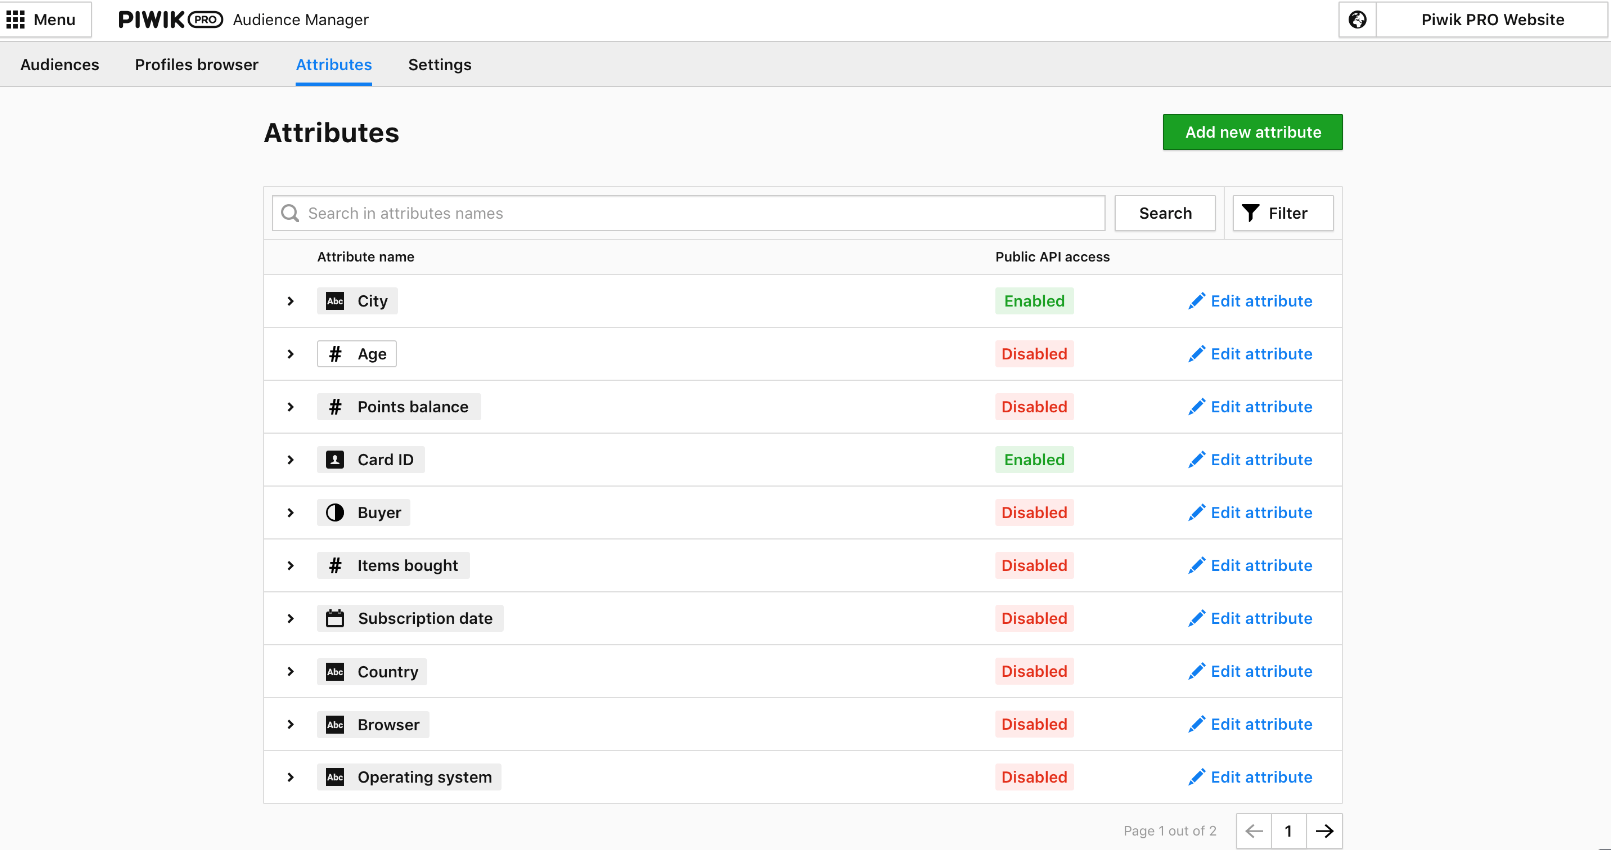
- Our Audience Manager (Customer Data Platform) has received a brand new design for attribute lists. Also, from now on user profiles will be automatically enriched with selected location data.
And that’s it in a nutshell. If you want more details on improvements and changes across our products, be sure to check our changelog.
Wrap-up
As you can see, our team is constantly striving to improve our offerings. That’s why this fresh update brings loads of advancements and upgrades. But this isn’t just a product of our efforts – we’ve made it our top priority to listen to our customers’ needs. User feedback is the foundation of our products’ evolution, telling us what new and better functionalities we can introduce for our customers to get the most out of analytics.
Stay tuned for more new features and updates, and if you have burning questions right now, just …