
With analytics software at hand, marketers are well equipped to devise their tactics and make an informed decision. However, having a great tool is not enough: the key is to get the most out of it to make it work for your specific needs.
In today’s post we’ll walk you through using Custom Reports for convenient comparison of segments and time frames to give you a bigger picture of how your site, platform, device or app are performing.
Also, we’ve got good news for Matomo (former Piwik) users, who will receive a considerable advantage. Firstly, they get an extra functionality for comparing data ranges which wasn’t possible before launching Custom Reports.
Secondly, they won’t have to deal with poor user experience since comparing segments is now a lot more convenient. Meaning, you’re not limited to seeing reports only as dashboards.
Telling a story with data
Keep in mind that data is more than just numbers. Your data must tell a story, and that always requires context. Following Avinash Kaushik’s advice, “the cheapest way to give context to your performance is to use comparisons to other time periods.”
So, before you draw any conclusions from the numbers, he suggests asking a couple of questions like:
- What is different about this year and last (or this month and last)?
- Have you doubled the team?
- Do you have free shipping this year?
- Have you spent a lot on GoogleAds this year?
However, comparing this year to the last one might not be enough, and it’s oversimplification that could skew your reports. You need to adopt a big-picture perspective and see broader trends. For instance, some shifts might be caused by the usual ebb and flow of your operations. You need to make sure your data tells a complete story.
Also, a part of your strategy should be to regularly conduct such analysis. And you need to keep a flexible approach, which means contrasting different date ranges throughout a year.
For example, by comparing quarter over quarter you’ll be able to better track progress towards your annual goals, keeping on top of things and able to take action at the right moment. Or you can contrast month over month. That all depends on your business needs.
But before we move on to the details of running your report, let’s find out why you should compare time periods. So, by comparing time periods you’ll be able to see:
- How your traffic has risen or dropped across time
- Exactly which channels have contributed to this rise or drop
- If there are any issues or roadblocks you should fix
- What kind of traffic converts
All in all, as you juxtapose different time frames you can get deeper insights, spot trends and issues, analyze them and finally take action based on precise data.
On the other hand, segmentation tells another story you can’t ignore. Unlike aggregated data that makes you believe all visitors bring the same value to your business, segmentation helps you understand which visitor groups are more valuable.
Visitors coming to your site are not the same. They have diverse interests and purposes, they act differently. In order to better serve them, to engage them with the right content and to make the most of your web analytics, you need to segment users with similar characteristics.
Divide your audience into groups by traffic source, device, operating system, new vs. returning visitors, and visitors downloading your content. You can narrow your traffic as precisely as you need to. This will allow you to better allocate your effort, energy and budget.
Comparing segments
Now that we know the theory, it’s time to put it into action. Let’s start by creating segments in the Analytics module. You can divide your audience into mobile and desktop users. In this way you’ll be able to easily compare pages, sources of visits, the technology involved (internet browser, operating system) and see whether desktop or mobile gets better results.
Psst! There are more articles on creating and using segmentation, so check them out:
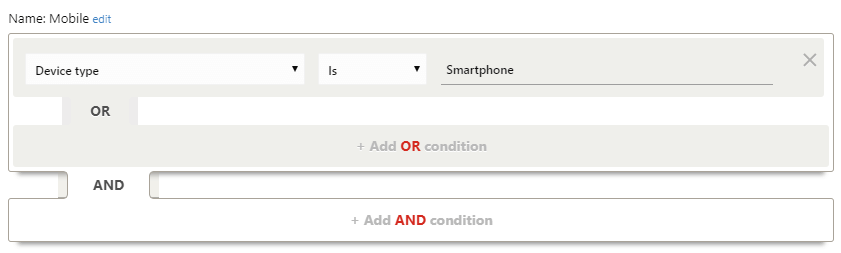
First, define segments for mobile users:
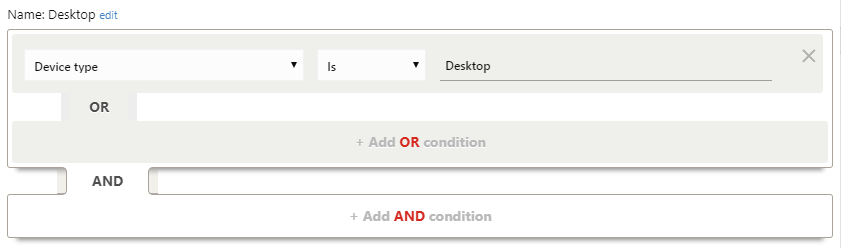
Then, do the same for desktop:
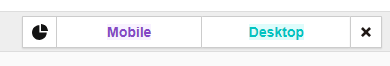
Next, in Custom Reports you need to set up the comparison of your desired segments. For this purpose just select the ones you need from the list:
Of note, the above configuration is just a simple example. Whatever your business requirements, you’ll be able to easily juxtapose various operating systems and browsers. You can also define segments to compare how different locations or regions perform – for instance, DACH vs Benelux, America vs Europe – or have a closer look at devices, channels, etc.
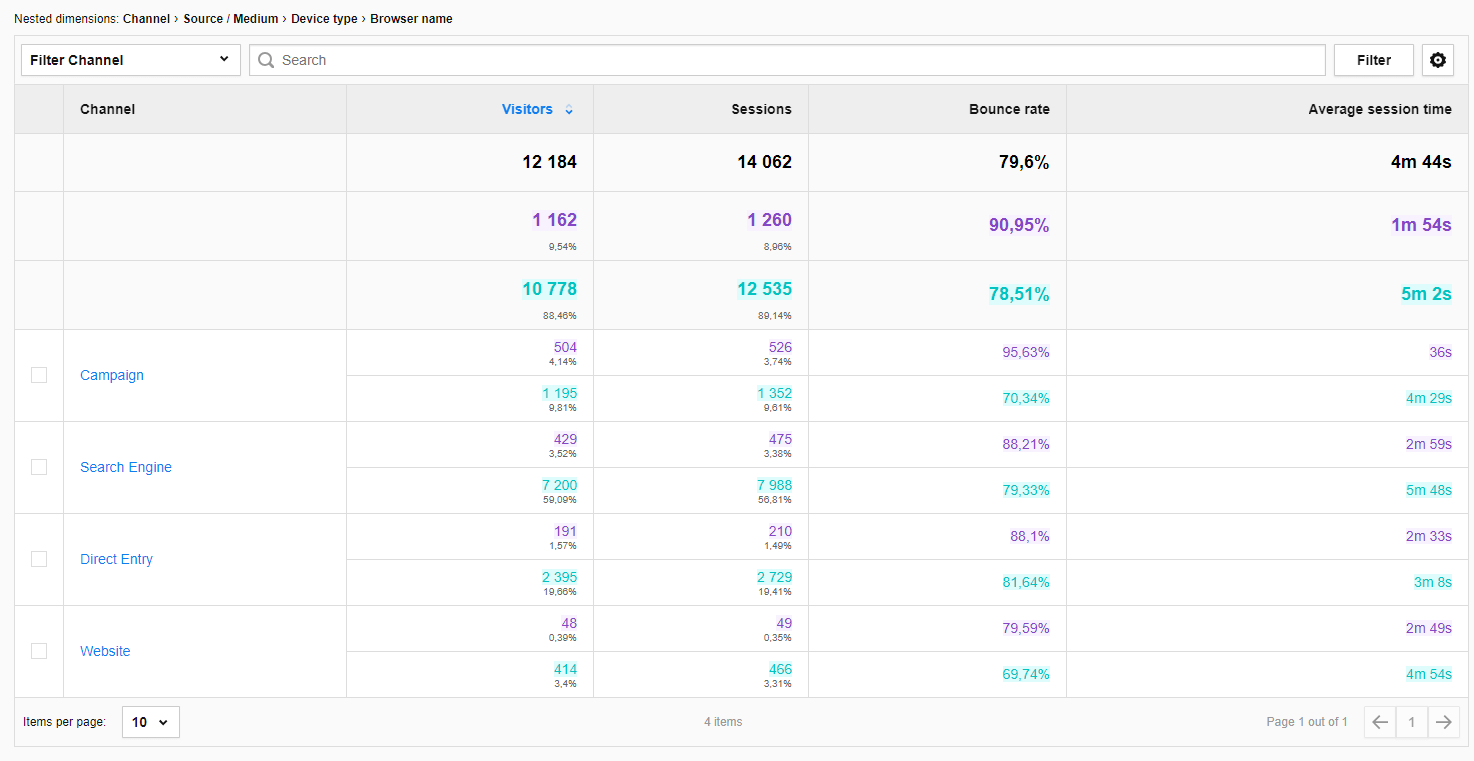
Then, using a report called an explorer you can present the segment data in charts and tables.
Here’s what they look like:
Chart:
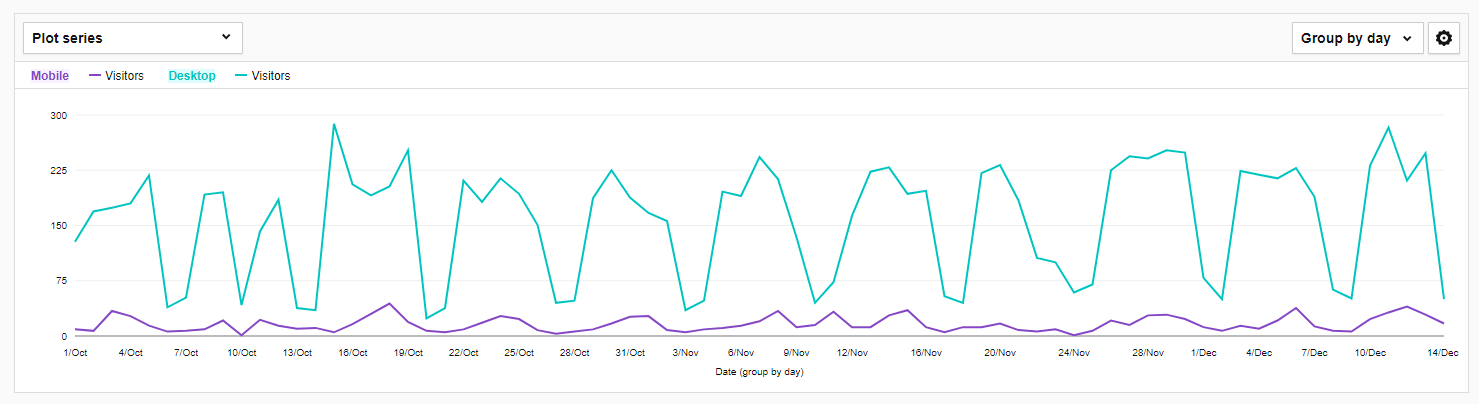
Table:
Date range comparison
Now we’ll compare time periods. But before you dive into your report, bear in mind that web traffic is seasonal. At different times of the year you run different campaigns depending on your business strategy. Visitors tend to be less active in the summer or around holidays, and you need to take that into consideration when you contrast and analyze various time frames.
Finding out when visitors engage more with your content and when there are fewer bounces on various sites could be an enormous help for you in spotting the best-performing content across different time periods.
For instance, in August of last year, what landing page recorded the highest engagement time and the highest number of page views? That would be a great clue to start your analysis and compare results between this year and last.
So, if you want to compare the same periods from this year and last year, here’s a possible setup:
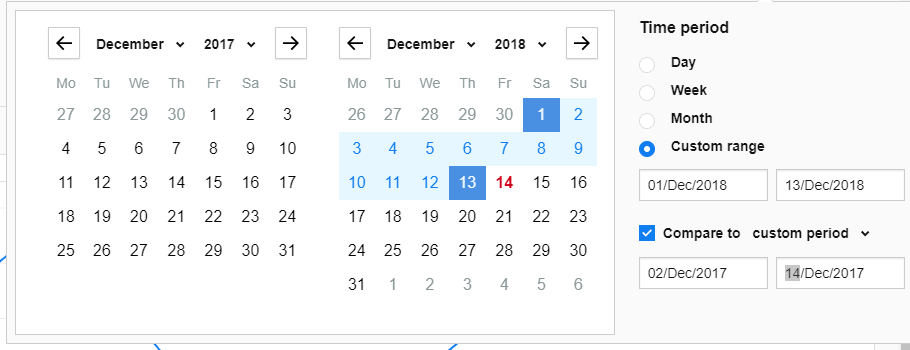
Pro tip: To maintain the seasonality of the week you should select the same range of days of the week.
In the example above:
2018: December 1st is Saturday and December 13th is Thursday. So when choosing dates, make sure the days of the week match; in other words, pick the following dates for 2017: December 2nd (also Saturday) and December 14th (also Thursday).
And here you get your charts:
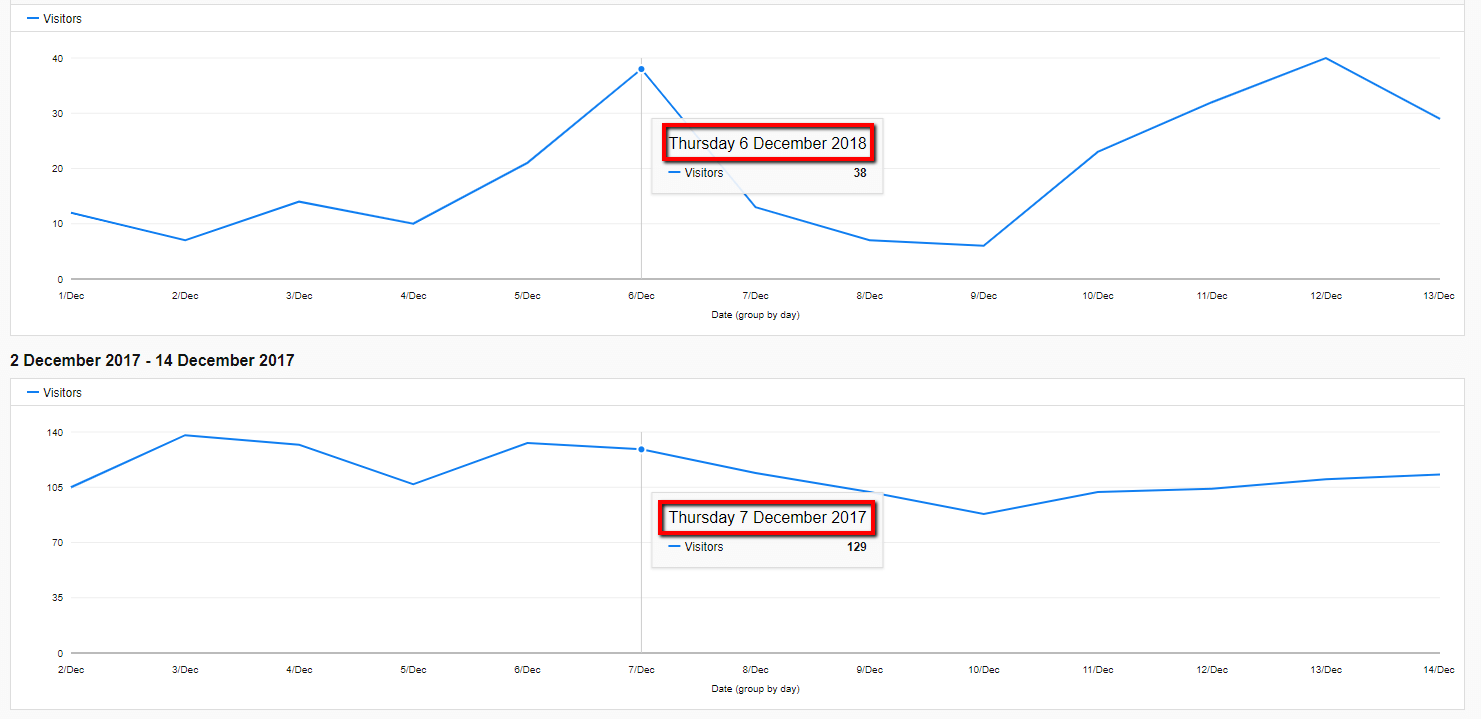
And here’s a table:
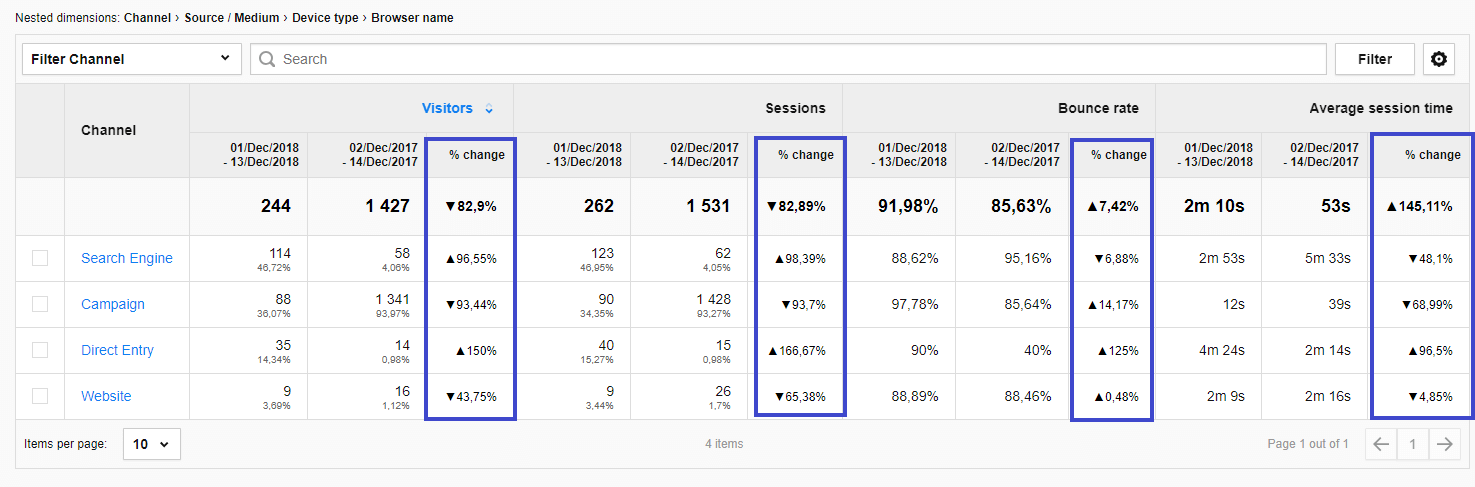
Voilà! Your report is ready. The table provides you with a complete view of the compared periods. The change column shows the differences in percentages, so you can better see all the shifts that take place during the analyzed periods.
Such analysis helps you find not only trends you should follow, but also their source, giving you a wider perspective of your web or app performance. On another note, if the report reveals some serious dropoffs, you can easier find users’ pain points and fix them on the spot.
Final thoughts
You’ve got a wealth of data at your fingertips thanks to your analytics, so you need to make sure you have a sound strategy in place to benefit from it. This means paying attention to trends and traffic seasonality. You can always consider making a small change and then tracking it to see the results – if it works you can keep it, if doesn’t then you drop it.
Sometimes it’s a small tweak that can make a big difference. On top of that, by knowing how to segment your visitors, you will be able to optimize your tactics even more finely. All that lets you provide content, products and offers at the right time and to the right audience.
We hope that this post has helped you learn how to get better insights and make your website flourish. And if you have any questions about today’s topic or want to find other ways to act on your data…