
Many factors can determine the success of an application. Understanding users’ needs is one of the most important. This is where mobile app analytics steps in, offering a wealth of insights into users’ behavior inside your app.
That said, using mobile app analytics in isolation from data from other touchpoints gives you only part of the story. Combining mobile app data with different sources of information provides you with a broader perspective on the user journey and your business performance.
All this might sound challenging at first, but we’re here to help.
Read this guide to learn:
- Key concepts around mobile app analytics
- Mobile app analytics goals and metrics
- The benefits of integrating mobile app data with data from different touchpoints
- The privacy compliance aspects of mobile data collection
- The differences between 6 most popular mobile analytics platforms
What is mobile app analytics?
Mobile app analytics is a specialized field of mobile analytics. It’s the practice of collecting data about the behavior and characteristics of mobile app users.
Mobile app analytics is typically done with the use of a dedicated piece of software integrated into your app. Analytics platforms provide you with insights necessary to improve acquisition, engagement, retention and the app’s performance.
Mobile app analytics and web analytics: Key differences
Mobile app analytics and web analytics share the same goal – help you capture data and transform it into meaningful reports. But there are some important differences between the two types of analytics.
Tracking methods
Most web analytics platforms collect data about users of both mobile and desktop browsers. To do so, they usually rely on JavaScript tracking codes and use cookies to identify users.
Mobile apps, on the other hand, require the use of software development kits (SDK) to integrate with analytics. Mobile analytics recognizes app users based on their unique ID or assigns to users a session ID every time they log into the app.
Metrics and dimensions
Both types of analytics utilize similar sets of metrics and dimensions, with few significant exceptions. They result from how websites and apps are built. For example:
- Web analytics operates on page views, while app analytics uses the term screen views
- In app analytics, the metric known as site speed is called mobile app speed
What’s more, mobile app analytics puts a bigger focus on custom events, as they’re helpful for translating an app’s architecture into analytics terms.
Because of these differences, many companies track their mobile apps with a different piece of software than they use for websites or products. But that’s not the only option you have.
You can analyze apps and websites using the same analytics platform. What you need in this case is a web and app analytics platform that offers SDKs compatible with your application.
What is an analytics SDK
An SDK is a set of software tools and programs. Developers use them to create applications for specific platforms, such as iOS or Android, or cross-platform frameworks, such as Flutter or React Native.
SDKs streamline the analytics process, as developers don’t need to write unique tracking codes to integrate analytics with the mobile app. Instead, analytics SDKs provide a package of pre-written code that developers can insert into applications. Developers use this code, for example, to create dimensions and metrics and collect different types of data, such as location, usage, or behavioral data.
To learn more about the role of SDKs in mobile app analytics, watch the recording of our webinar.
What types of data to collect with mobile app analytics
Mobile app analytics provides you with broad possibilities for data collection. But not every piece of data will be equally important.
One of the key steps at the beginning of your analytics project is to come up with a tracking plan. This will include deciding on what types of events, metrics and dimensions you’d like to see in your analytics reports and how you’d like to recognize your app’s users. As every application has a unique structure, this might require creating custom events and dimensions.
The key events you’ll keep tabs on to see if your app is performing according to plan will be your goals and goal conversions.
Apart from custom events, there are many events, metrics and reports dedicated to app analytics. Below we list some of the most helpful ones. We grouped them according to the common business objectives for mobile apps.
Most popular goals for mobile app analytics:
1) Improving user acquisition
Using mobile app analytics, you’ll be able to analyze how your marketing campaigns influence the number of new app users. You will also get the tools necessary to evaluate your results on different marketing channels and recognize sources of the most engaged users.
Mobile app analytics metrics, events and reports related to user acquisition:
- Downloads – shows how many people download your app. It’s a strong indicator of the performance of your marketing campaigns.
- Installations – presents how many users installed your app.
- Registrations – lets you see how many users decide to register in your app.
- Campaign attribution – allows you to assess which campaigns, marketing channels and mediums bring the most conversions.
2) Increasing user engagement and retention
Mobile app analytics allows you to analyze the full user journey inside your app. Analytics reports let you see what users interact with, how long it takes them to fulfill a certain task and when they decide to leave.
Having all this information makes it easier to spot the elements of your app that hinder user engagement and retention, be it unintuitive features or complicated conversion funnels.
Mobile app analytics metrics related to user engagement and retention:
- Active users – the number of unique users who engage with your app within a particular period of time.
- Retention rate – the percentage of users who continue using your app over a given period.
- Churn rate – the percentage of users who abandon your app over a given period of time.
- Screen views – the total number of viewed screens.
- Sessions – the total number of visits to your application.
- Session length – the amount of time a user spends in the app during a single session.
- Bounce rate – the percentage of people who open your app and exit without any interaction.
- Content impressions and interactions – shows how many times a specific piece of content was displayed to users and the number of interactions with it.
- Social interactions – represent likes, shares and comments – in various social networks or in your app’s social features.
3) Optimizing user experience (UX), satisfaction and app performance
You’ll resolve many user experience issues by analyzing user engagement and retention. That said, there are more technical metrics and events dedicated to performance and UX. Looking at them will help you make sure your application functions properly and is easy to navigate.
Mobile app analytics metrics related to user experience and app performance:
- Load time – how much time it takes for an app to load from the initial tap to being ready to use.
- Searches – what queries users are looking for by analyzing terms typed into the search bar.
- Crashes/exceptions – helps you spot and fix stability issues and errors inside your application.
4) Increasing the number of in-app purchases (ecommerce tracking)
Increasing revenue is the ultimate goal for every application with ecommerce features. If your application offers in-app purchases, here are some essential metrics and events for you to follow:
- Ecommerce transactions – a type of analytics event that lets you track the number of purchases inside your app, the quantity of the items purchased and their total value.
- Custom events with a value – if the in-app purchases can’t be classified as ecommerce transactions or if you’d like to use more flexible types of events, you can use custom events that let you specify the value.
Additional reading:
How to analyze mobile app data
There are many types of useful reports for analyzing mobile app data. Custom reports and flexible dashboards allow you to adjust reports to your needs, pick dimensions and metrics and decide how you present data.
But there are two reports particularly useful in mobile app analytics – user flows and funnels. As users take many journeys inside the applications, analyzing their paths simplifies spotting places and app elements that cause friction and drop-offs.
Let’s see how these reports work in practice.
Mobile app analytics – user flow reports
Imagine you’re developing a healthcare application. One of its functionalities is called “Find a doctor”. It lets patients book appointments with doctors of different specialties.
To check if your app allows them to easily complete this task, create a user flow report that begins on the “Find a doctor” screen. After you configure the report, you see the following set of data:
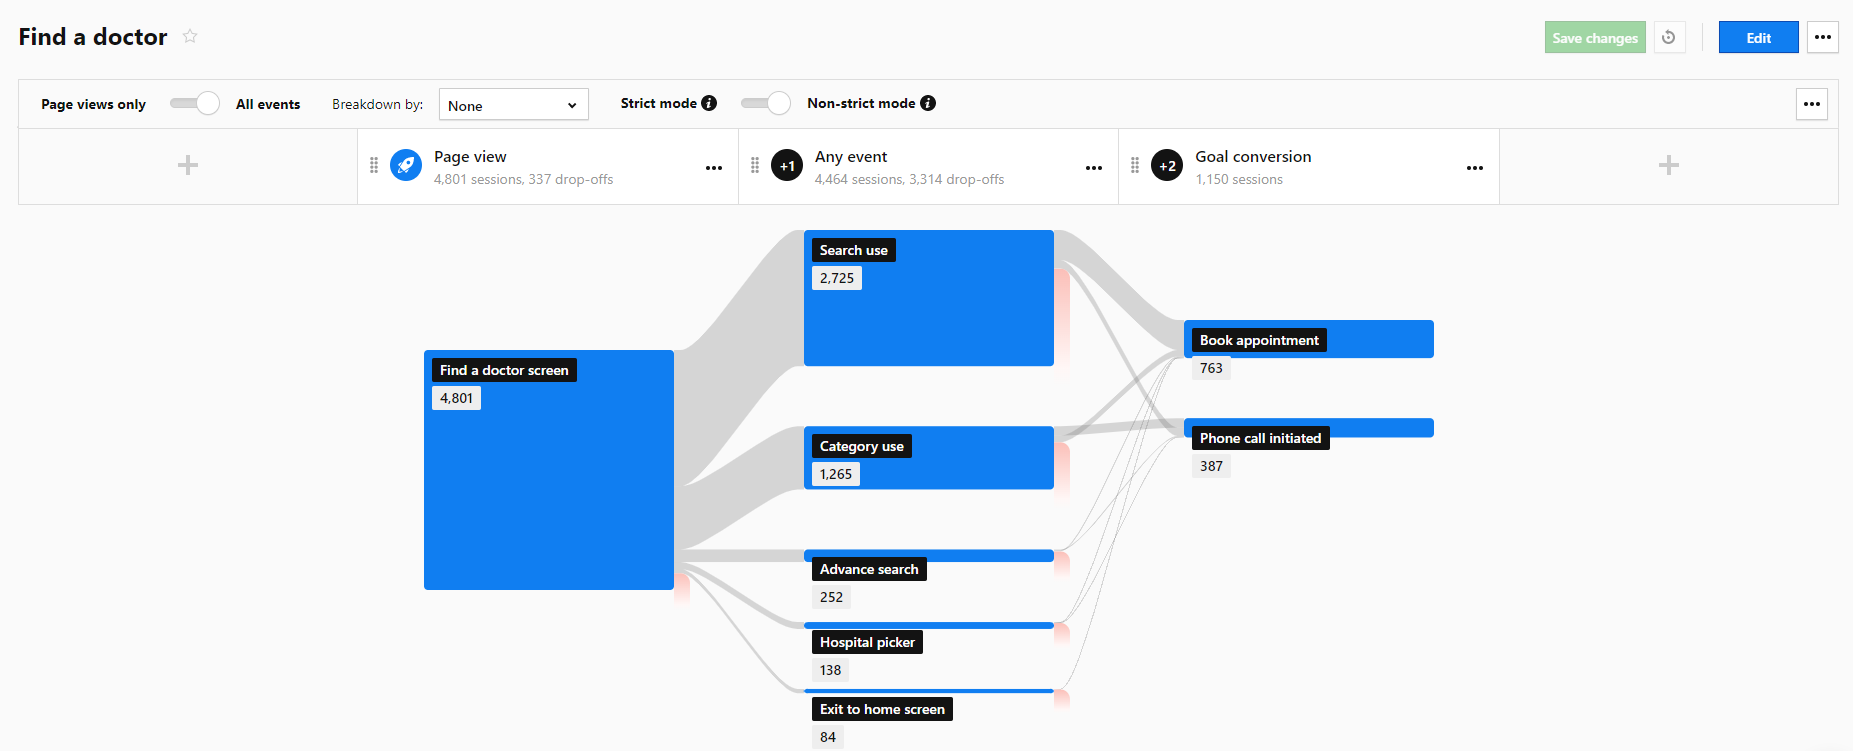
The report shows that users tend to use a search to find the doctor more often than the navigational categories you created for them. This might suggest that the names of categories are unintuitive for users.
To verify this hypothesis, you could run an A/B test to check if different category names are more understandable, and therefore more frequently used.
Learn more about optimizing user flow with analytics.
Mobile app analytics – funnel reports
Now, let’s say you’re running an app for online banking. Your goal is to optimize paths that lead to up-sells. In this case, you want to make sure applying for a loan inside your app is an effortless process. Using funnel reports, you can easily optimize user paths that lead to this conversion. The reports will show the steps of this journey and the drop-off rates between them:
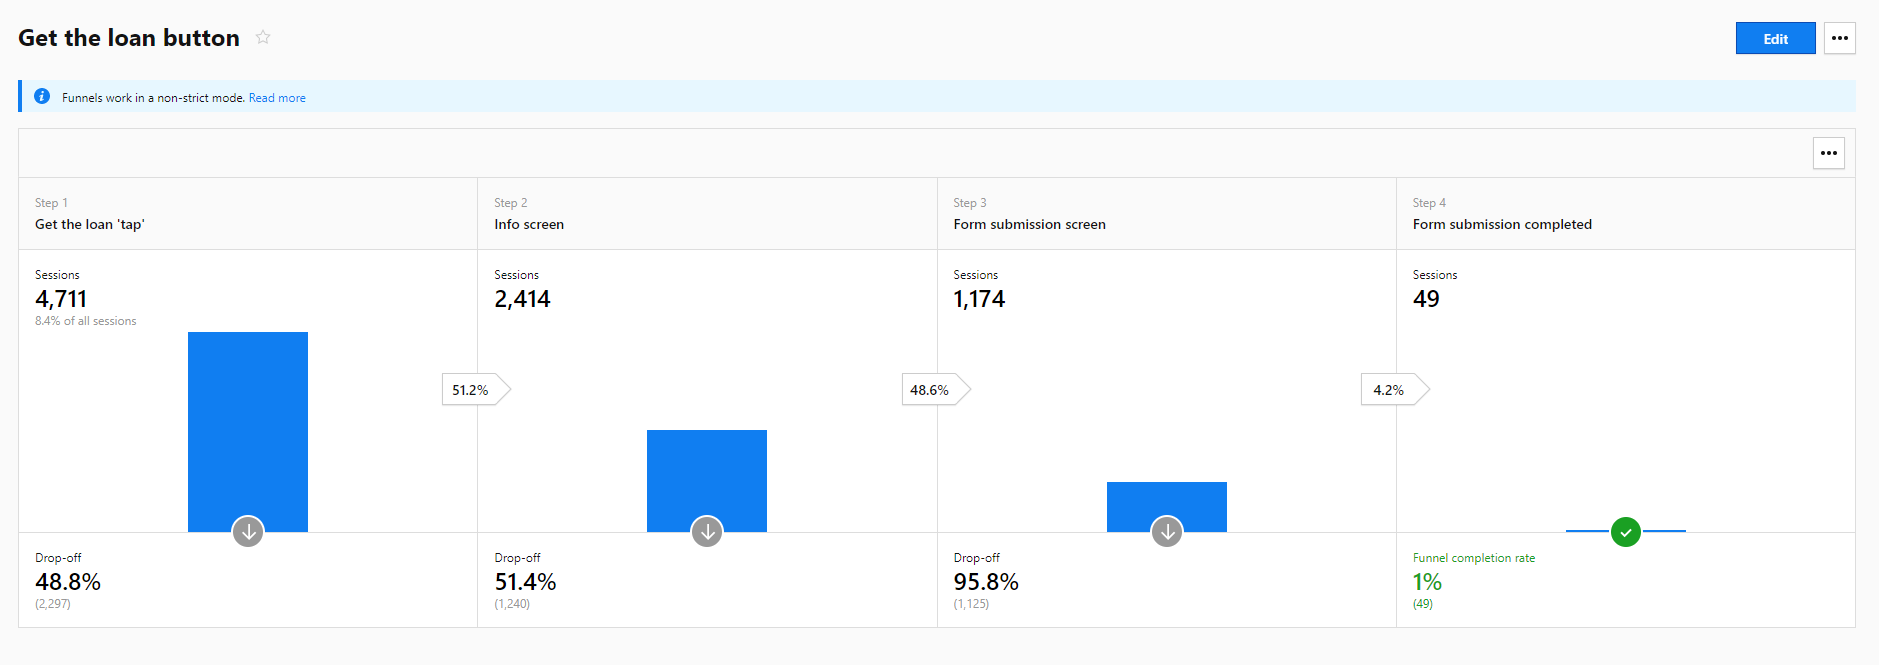
This kind of data allows you to discover potential barriers along a single user path. By analyzing the content of screens with the highest drop-off rates, you can find and fix the elements that prevent users from filling out the form and increasing your bank’s revenue.
Additional reading:
pro tip
Segment your data to get more details. Segmentation is a method of dividing your analytics data into more manageable chunks. Create segments of visitors who share certain traits or behaviors, for example:
- device types
- operating systems
- location
- acquisition channels
- subscription plans
This will give you a granular perspective on your audience and the way they move through different stages of their journey. Learn more about the benefits of segmentation from this helpful use case.
Combining app and web analytics data for better customer insights
Detailed analysis of user behavior and your mobile app’s performance is essential for making improvements to your app. But analyzing this data in isolation from the performance metrics from different touchpoints gives you a limited view on your business results.
That’s why it’s great to have a way of integrating your mobile app data with information from ad platforms, App Store analytics, mobile apps, marketing websites and customer relationship management platforms (CRM).
You’ll be able to create reports that combine data from multiple sources to get detailed insights into user behavior. This will let you calculate the proper cost of customer acquisition per channel and oversee the performance of all important touchpoints in one place.
There are a few different ways of getting this kind of executive overview:
- Using an integrated web and mobile app analytics platform – this will allow you combine data from your websites, app and products and analyze it with metasites.
- Integrating your data points into a customer data platform (CDP) – lets you merge different sources of first-party data, including CRMs, web, app and product analytics, into rich customer profiles and segments. In this case, you’ll need a mobile app analytics platform that integrates with a CDP.
- Exporting data to an external business intelligence (BI) tool or data warehouse – gives you the ability to unify multiple data sources and create advanced dashboards and reports with the use of BI tools such as Power BI or Looker Studio (formerly Google Data Studio). For that, you’ll need to set up an integration that will export the data in a ready-to-use format. Then, you will be able to start working with it in your tool of choice.
If this sounds interesting to you, make sure that the analytics platform you choose supports these use cases.
Additional reading: How to run web & app analytics projects across banking groups
Mobile app analytics and data privacy
Finally, when thinking about analytics, always consider users’ privacy and data security. Mobile apps don’t use cookies, not even first-party ones. However, apps often handle personal data. However, apps often handle personal data. To make sure you collect data in a privacy-friendly way, employ a strict form of data anonymization. When it’s enabled, you don’t collect any personal details, but still get valuable data to make informed improvements to your app.
Another critical aspect is data residency. This applies especially to companies handling information from EU residents.
Recent verdicts of several European data protection authorities (DPA) suggest that Google Analytics, including Google Analytics for Firebase, might soon be banned in the EU. The platform sends EU residents’ data to US servers, making it available for surveillance by US authorities. This violates privacy standards set out by the EU’s General Data Protection Regulation (GDPR).
Read more about the decisions here: Is Google Analytics GDPR-compliant?
To reduce the risks involved in EU-US data transfers, turn to an EU-owned platform that allows you to keep data in the EU.
To check how to collect and process app users’ data in line with different data protection laws, read these posts:
- 10 new privacy laws around the world and how they’ll affect your analytics
- Data privacy laws in the United States and how they affect your business
- Evaluate the HIPAA compliance of your next analytics project – a helpful checklist
- Product analytics & DiGA: How to optimize your health app for the German market
6 best mobile app analytics platforms (SDKs) – free and paid
Now that you know what you can achieve with mobile app analytics, it’s time to discuss the most popular platforms for the job. Below you’ll find a brief comparison of the six most popular mobile app analytics products, in free and paid plans.
It includes specialized mobile app analytics platforms such as Flurry Analytics and data.ai (formerly known as App Annie).
You’ll also find there four all-in-one analytics platforms with dedicated mobile SDKs:
- Piwik PRO
- Google Analytics for Firebase
- Mixpanel
- Countly
See how they differ in terms of user privacy, data integrations, hosting options, feature set and customer care services.
The best mobile app analytics platforms (SDKs) – free plans
All free mobile app analytics platforms have limitations, be it reporting capabilities, integrations or hosting options. They also require you to have the skills necessary to run a mobile app analytics project internally.
But some of them give you more in terms of privacy compliance:
| Google Analytics for Firebase (Spark) | Flurry Analytics | Mixpanel | data.ai (App Annie) | Countly Community | |
|---|---|---|---|---|---|
| Performance and features | |||||
| Part of a web and mobile analytics platform | |||||
| Privacy and security compliance | |||||
| Zero identity tracking – a stricter form of data anonymization | |||||
| EU cloud hosting available | |||||
| Reporting API | |||||
| Connectors to common BI and data visualization software | (third-party integration) | ||||
| Integrated with a customer data platform (CDP) | (third-party vendors) |
The best mobile app analytics platforms (SDKs) – paid plans
Paid plans of mobile app analytics allow you to use more reporting features, hosting options and possibilities for data integration. That said, not every vendor will support you with high-touch customer care, technical support and product training:
| Piwik PRO Enterprise | Google Analytics for Firebase | Mixpanel Enterprise | data.ai (App Annie) | Countly Enterprise | |
|---|---|---|---|---|---|
| Performance and features | |||||
| Company headquarters | EU | US | US | US | UK |
| Part of a web and mobile analytics platform | |||||
| Privacy and security compliance | |||||
| On-premises and private cloud | |||||
| EU cloud hosting available | (including EU-owned data centers in France and Sweden) | ||||
| Reporting API | |||||
| Integrated with a customer data platform (CDP) | third-party vendors | third-party vendors | |||
| Dedicated account manager, technical support and training | (paid extra) | (paid extra) |
Download the full comparison of 6 mobile app analytics platforms
Discover the essential differences between Mixpanel, Flurry Analytics, Google Analytics for Firebase, Countly, data.ai (App Annie) and Piwik PRO, in free and paid plans.
Mobile app analytics: Final thoughts
Mobile app analytics gives you reliable data and insights necessary to improve the user journey inside your app. For a better overview on your business performance, integrate this data with information from different touchpoints, including your website, CRMs or App Store analytics. To remain compliant in the process, make sure you properly anonymize your data and store it in a location that satisfies the demands of your regional or sectoral data protection laws.
If you’d like to learn more about how Piwik PRO Analytics Suite can help you achieve all of that, reach out to us. We’ll be happy to show you the capabilities of our product and its mobile SDKs.