
Whether it’s your website, product, or an app, when you’re thinking about your users, you surely have some goals in mind. Let’s say a visitor comes to your website – what would you like them to do? Sign up for a newsletter? Buy a product? Request a demo?
Well, users rarely take the path you’d like them to take. Instead, they often wander about in search of more information. They might even get bored midway and just exit your website or app without ever completing the goal.
This is especially true if a user enters a home page with lots of navigational options or a range of product categories. They might feel lost and need time to find what they’re looking for.
This is where you step in, to help your users reach their goals faster and more efficiently. In other words, to optimize user flow.
If you want to be their knight in shining armor, you shouldn’t go into this battle blind. Arm yourself with the best tool there is – solid data. You’ll find it in user flow reports.
What is user flow?
User flow reports give you a representation of:
- Pages on which users enter your website.
- Pages on your website they visit next.
- Pages on which they decide to leave.
This kind of analysis can be especially useful when optimizing:
- Visitors’ paths and funnels.
- Website’s navigational elements and menus (design, placement, copy).
- CTAs (design, copy).
By comparing the actual paths with the desired ones, you can make improvements to your website’s customer experience. The easier visitors can navigate through your site, the happier and more inclined to fulfil your conversion goals they’ll be.
To help you on this quest, we’ll show you three sample user flow reports that you can set up using Piwik PRO Analytics Suite.
What you should know about user flow reports
User flow reporting in Piwik PRO is relatively easy to configure, but at the same gives you room for advanced customizations. Working with it, you’ll be able to take advantage of the following features and options:
1) Three settings that help you analyze visitor paths:
- Standard: shows you the next interactions after the key interaction.
- Transitions: illustrates the interactions before and after the key interaction.
- Reversed: shows you the interactions preceding the key interaction.
Each of them will prove helpful in different situations – we’ll showcase their capabilities in the next section.
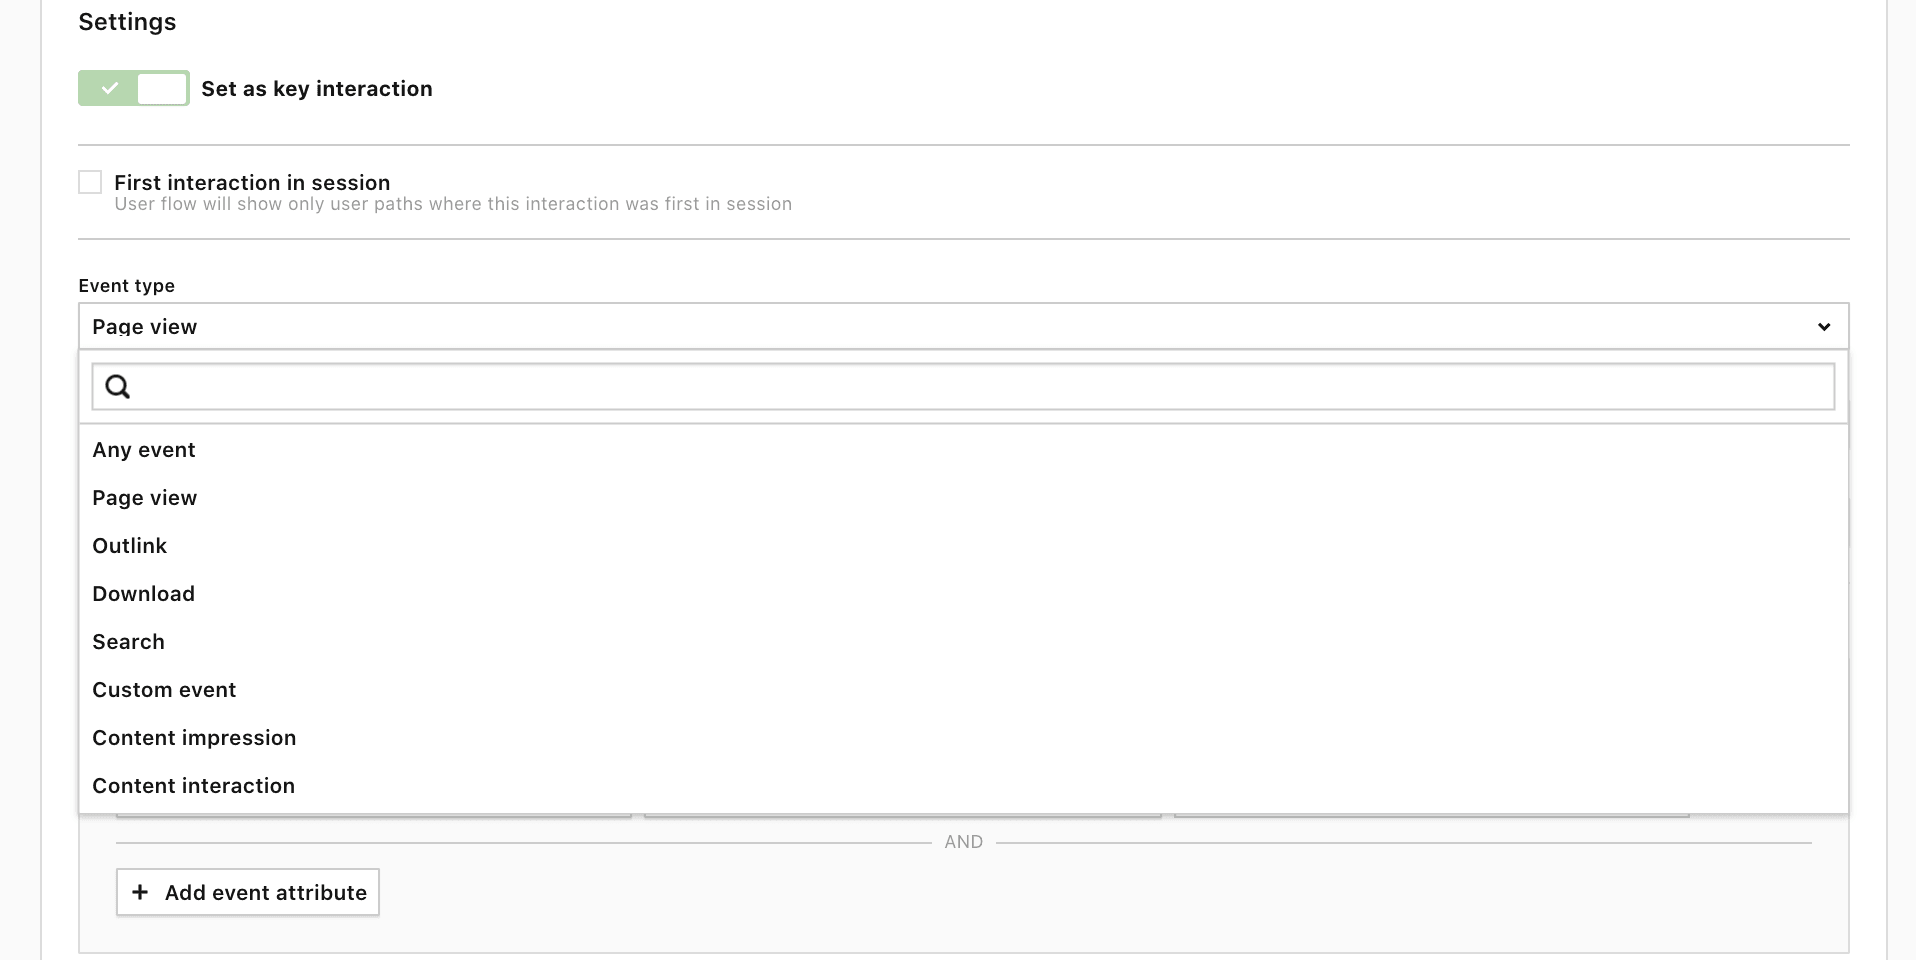
2) You can set up a user flow report for interactions such as a page view, download, search, custom event, and more:
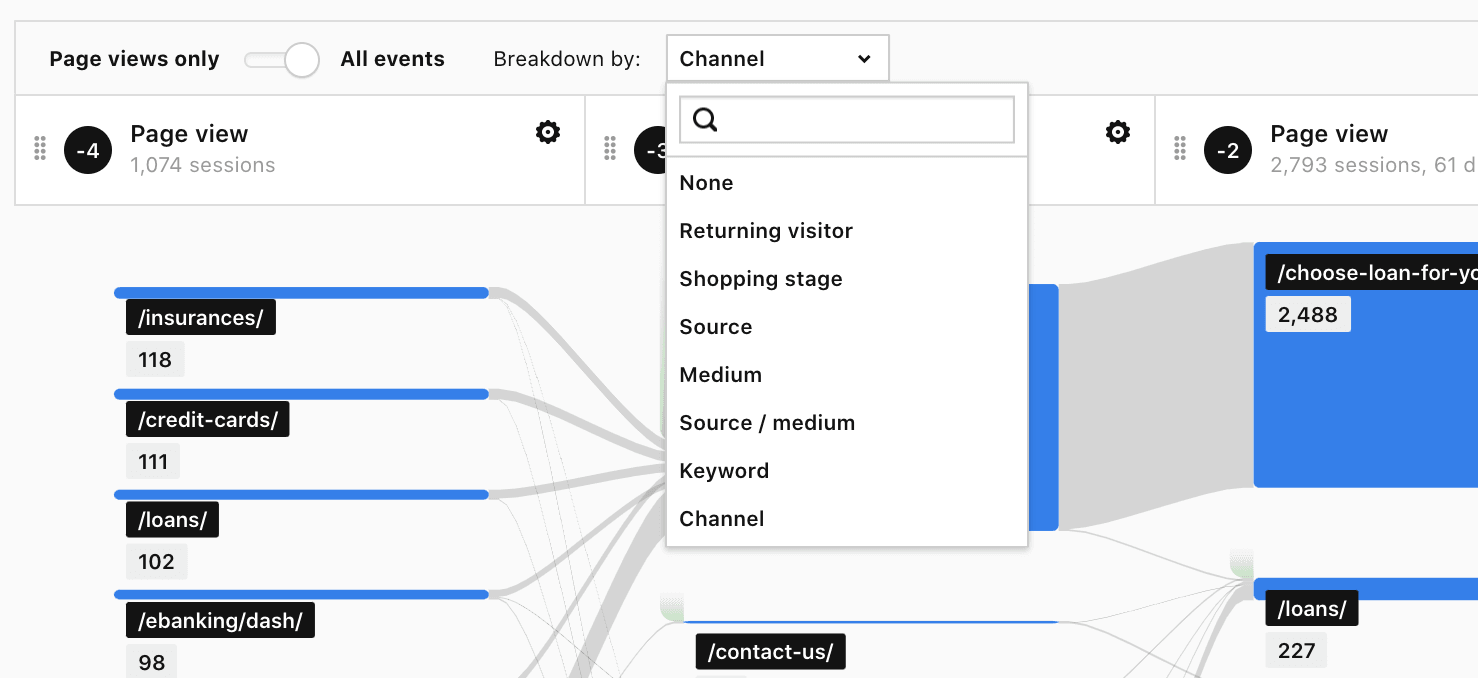
3) For each report, you can view a breakdown of dimensions related to sessions for the key interaction. For example, you can view channels, referrers, campaigns, and more:
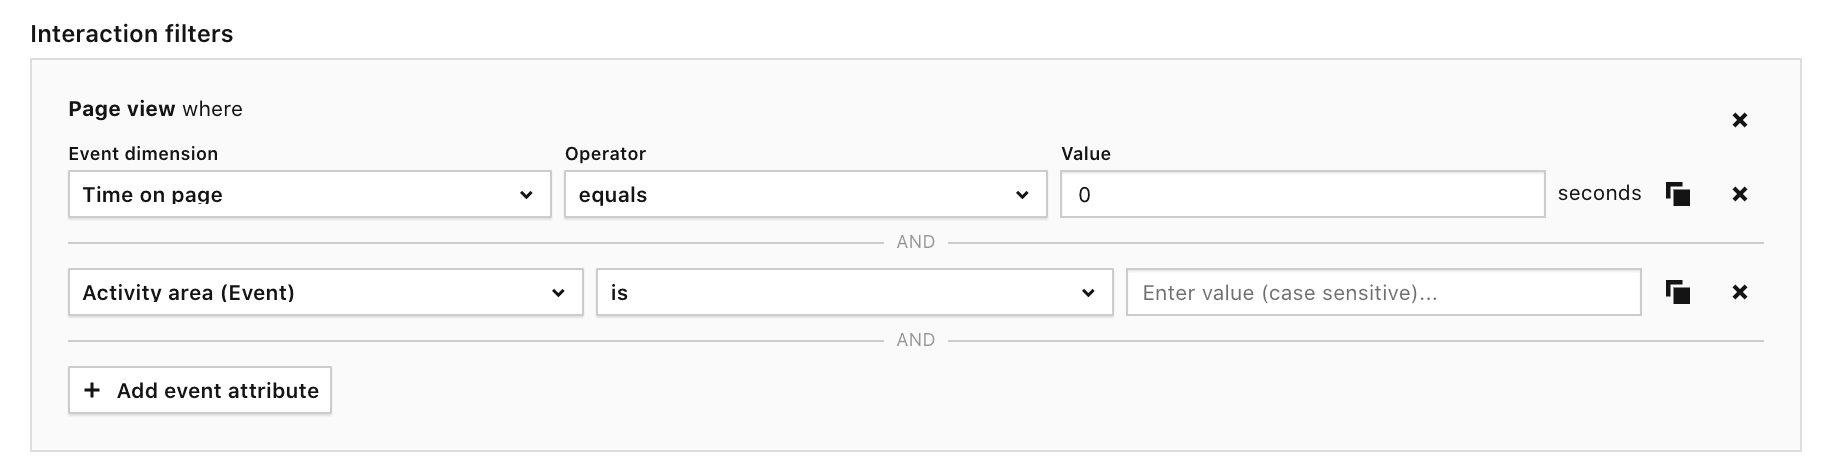
4) Every interaction in the flow can be filtered based on the type of event picked for that given interaction, e.g. if you choose a page view then you can filter it based on page view attributes:
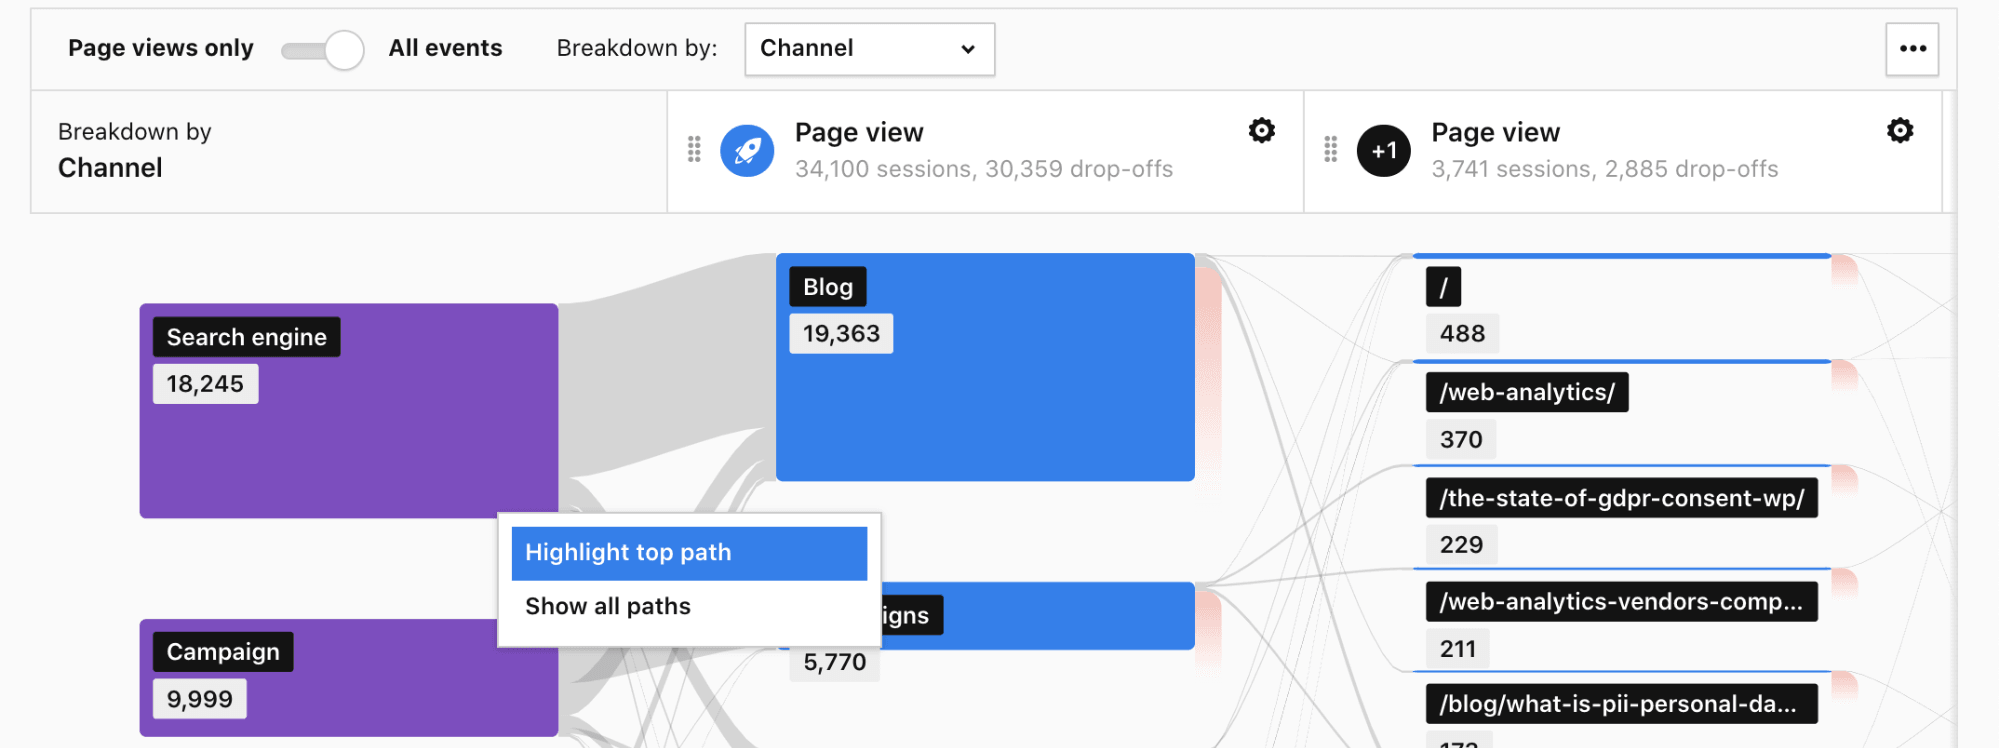
5) For each report, you can view a highlighted path that visitors use most often (you can also highlight such paths for each element available in each interaction):
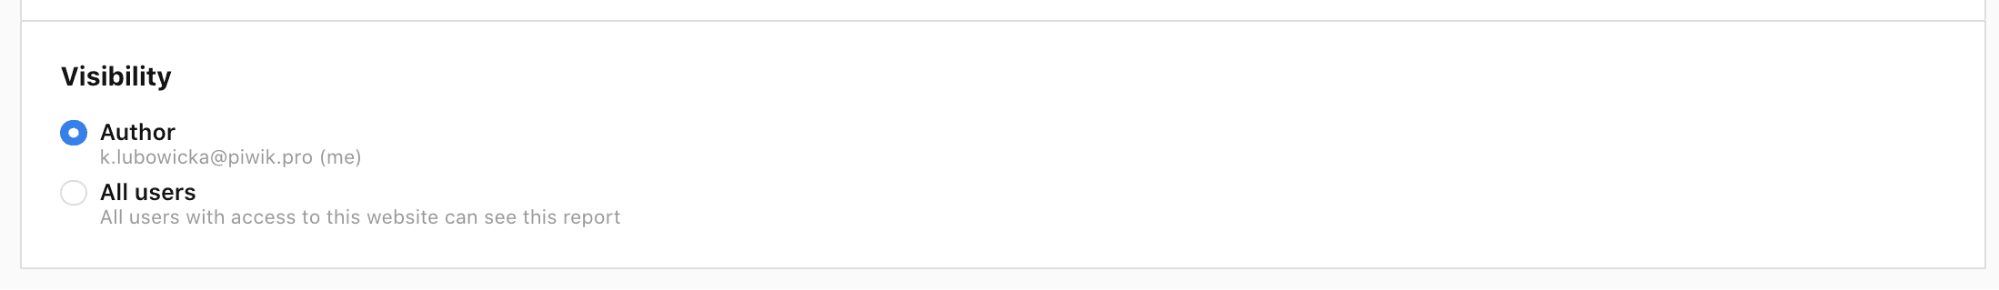
6) You can choose from visibility options Author or All users. With the All users option, you’ll be able to share your report with other teammates:
All this makes Piwik PRO’s user flow reports really flexible in the way they adapt to specific use cases.
Tip: User flow is also a built-in feature of every standard and custom report based on URLs, download URLs, and search keywords. You’ll find them under the blue icon with three arrows:
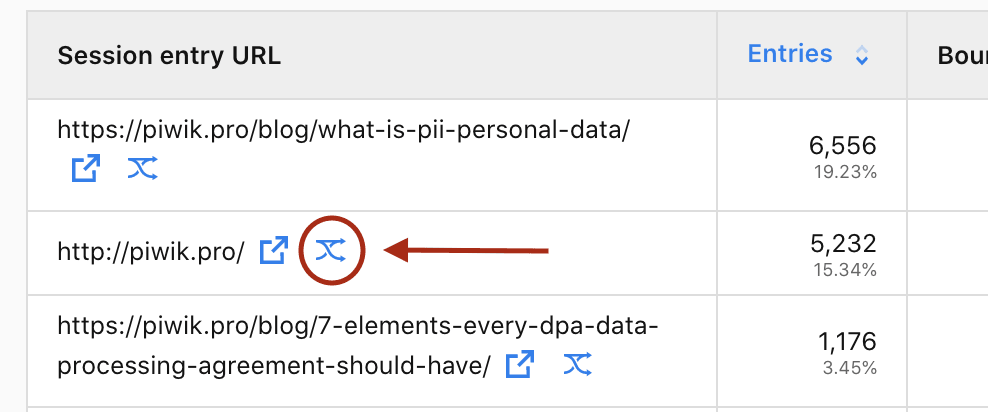
Using this functionality, you’ll be able to access the information about one step that preceded the visit on the site in question and one that followed it:
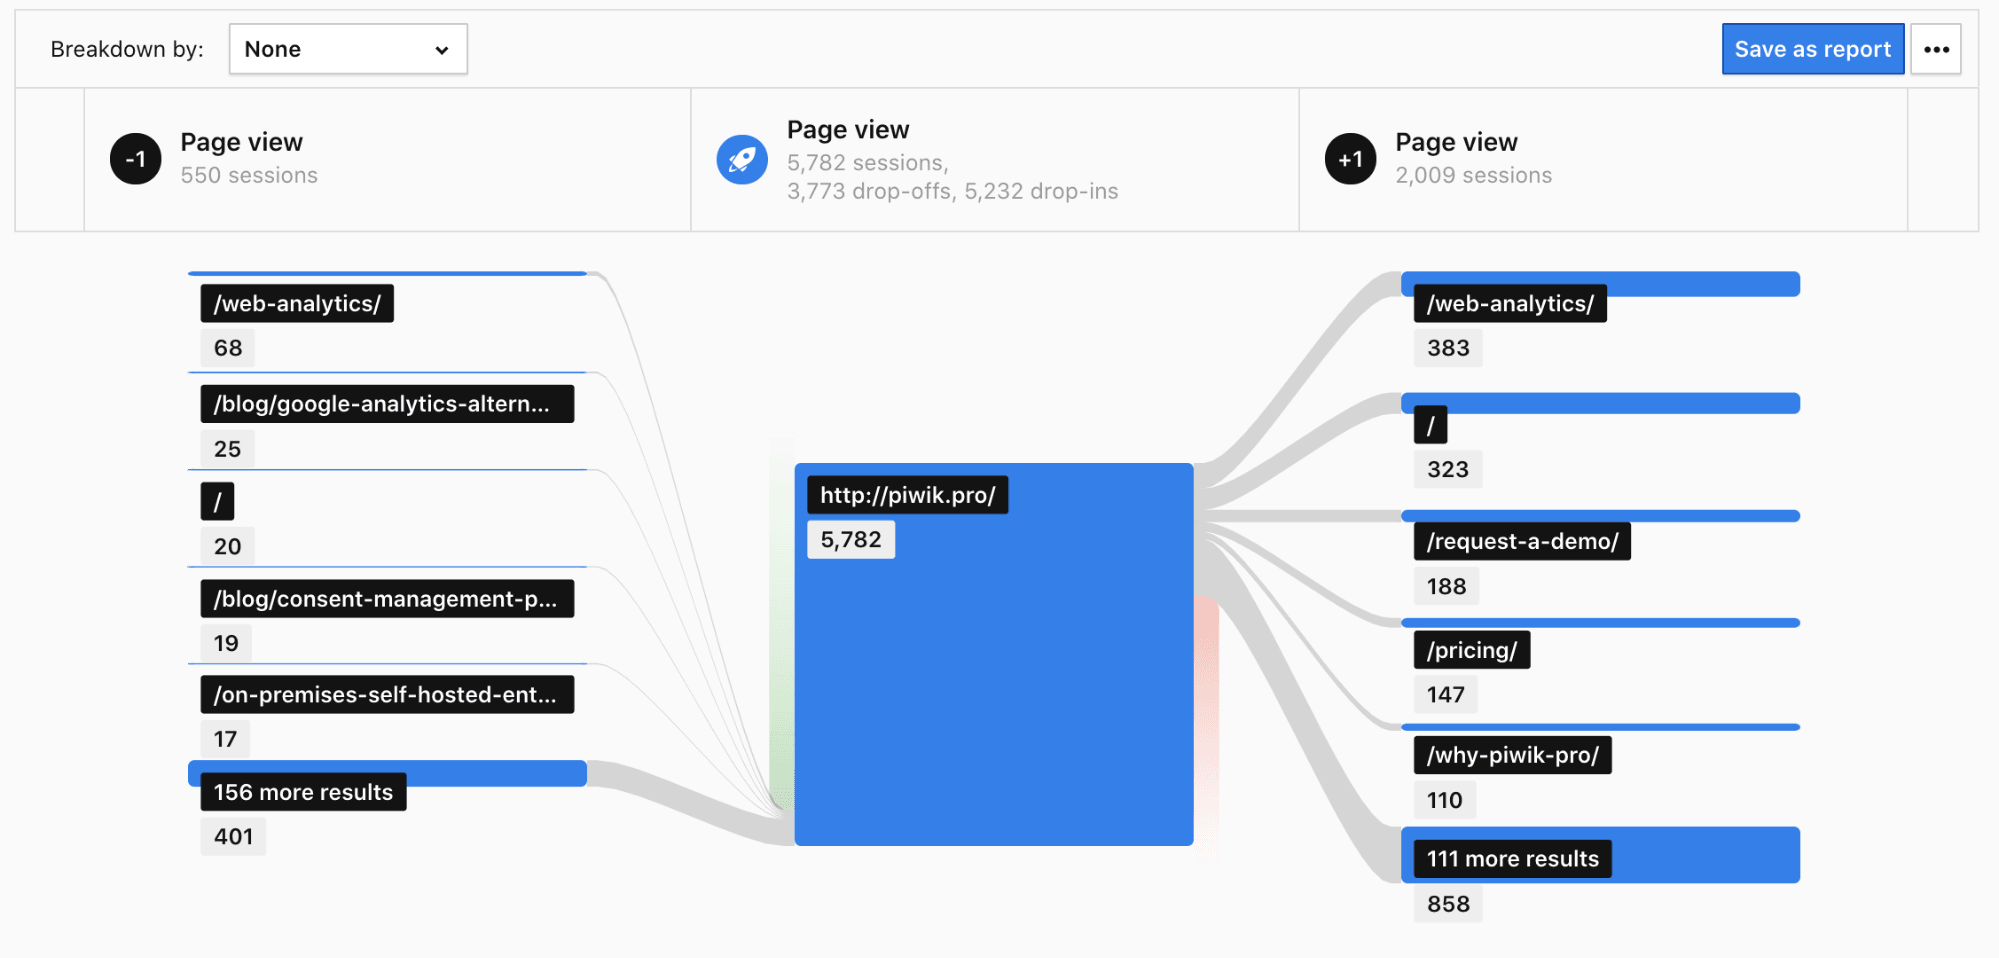
Quite handy, right?
The same report can be created once you are inside a user flow report. Each of the nodes within the steps can also have such a report.
Below we will show you some real-life applications of our reports with the use of our demo instances dedicated to healthcare, banking, and SharePoint analytics use cases. There, we’ll focus on the three main settings of the reports – standard, reversed, and transition.
Standard user flow – measuring effectiveness of your marketing campaigns
Let’s say you’re operating in the banking sector. You’re running two marketing campaigns: spring and winter. They are focused around three key products in your company’s offer – loans, insurance, and credit cards.
You want to know if your campaigns are bringing valuable traffic to your website. Namely – if the visitors arriving to your website from the ads end up buying your products.
To do so, you could use a regular user flow that starts with key interaction filtered by the product pages (Loans, Insurance, and Credit cards) and broken down by the campaigns’ names. That will allow you to narrow down the results to the data relevant in this context.
Here you can find a tutorial on how to set up a standard user flow in Piwik PRO:
This content is hosted by a third party (YouTube). By clicking the button below, you consent to loading the video.
Here’s the finished report:
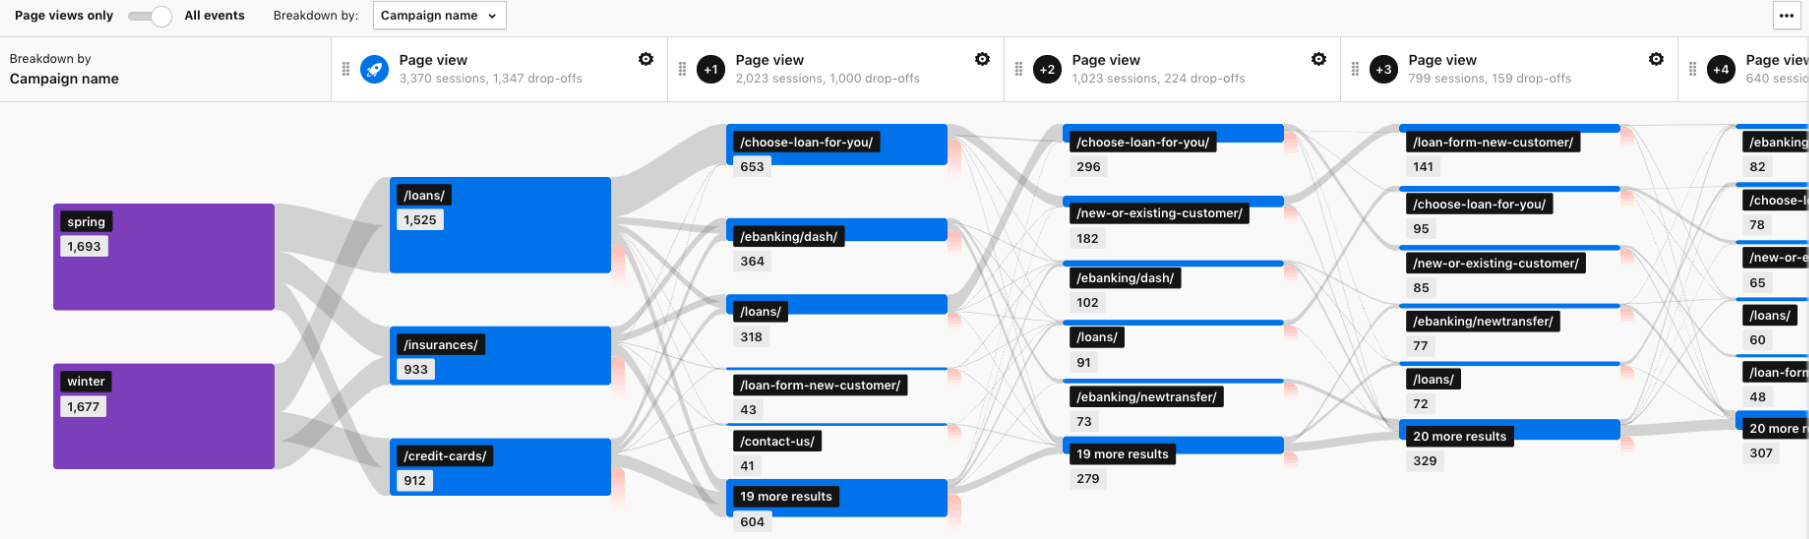
What you can see is that for people who landed on the “Loan” page, the most common path is to interact with the loan calculator located under /choose-loan-for-you/ URL and then to apply for the loan:
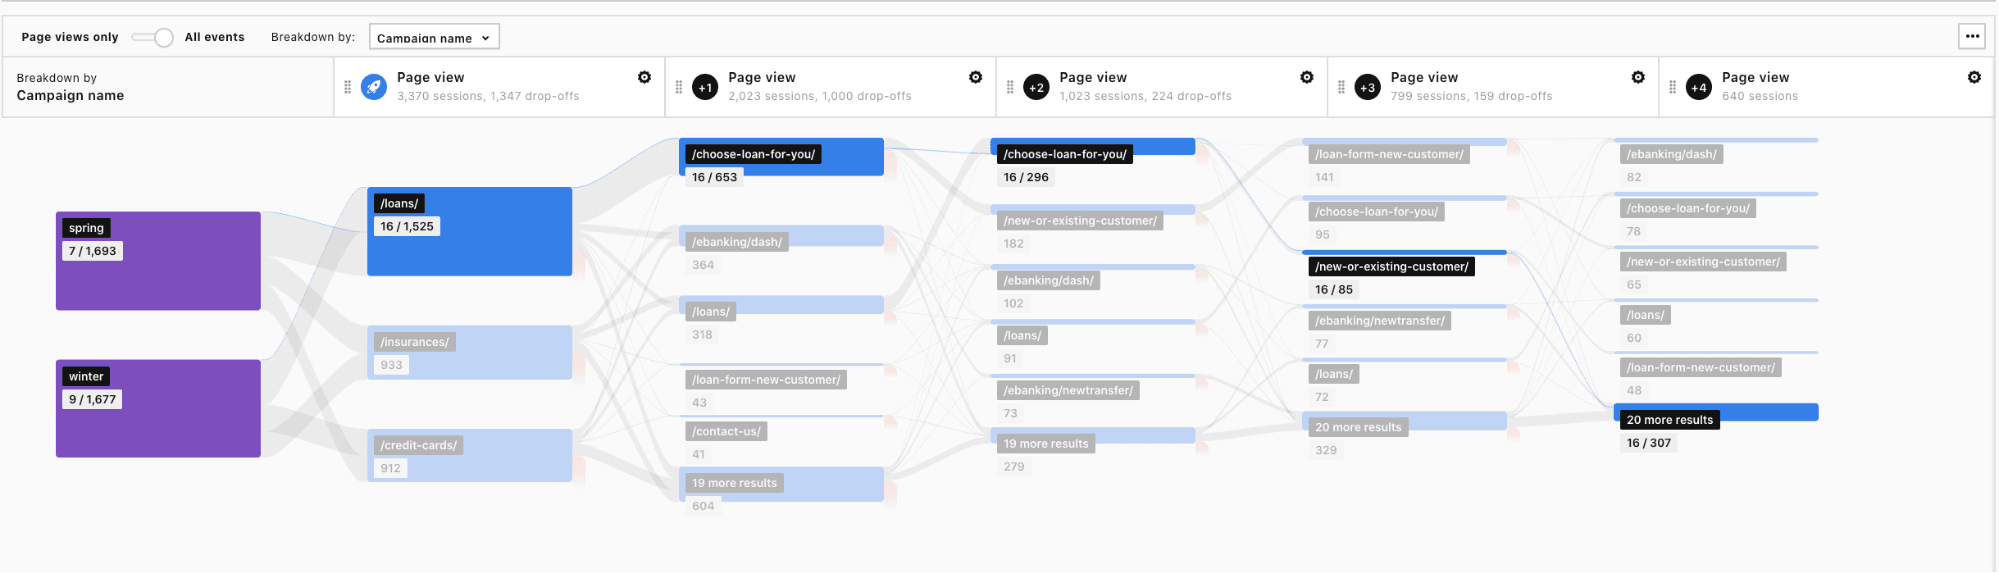
With other, less popular products, the user flow is split between the two most frequent scenarios:
- Visitors switch their interest to pages related to loans.
- Visitors log in to their e-banking platforms.
If you’d like to dig deeper you could segment your users and investigate i.e.:
- If your ads and website are optimized for mobile visitors.
- What paths are followed by visitors with different browsers and operating systems.
This information, paired with a diligent review of your ads and the pages visitors land on next, may show you if your content resonates with targeted audiences. It can also reveal UX issues that cause visitors to exit the website or search for the desired information in unexpected places.
Reversed user flow – finding out how visitors reach a certain website
Now, imagine that you’re a healthcare provider. In the upper right corner of your website there is a button that takes users to the page where they can book a doctor’s appointment:
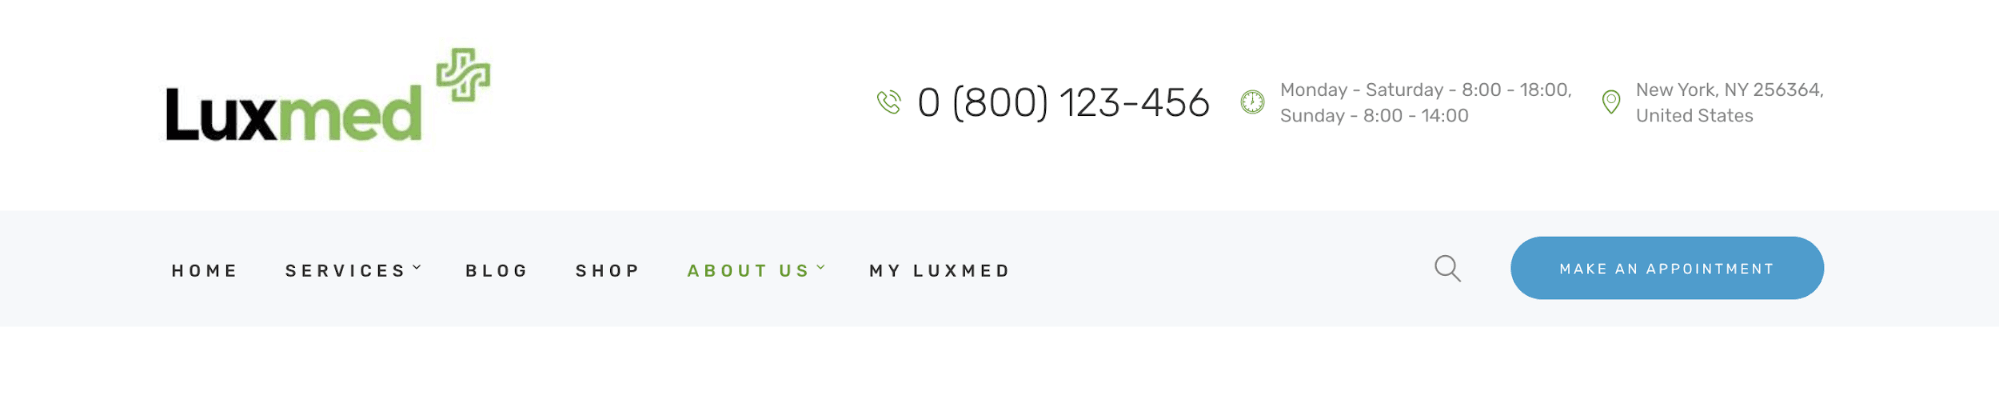
You would like to know what content they consume before they hit the button and schedule a consultation with a specialist.
To do so, you could use a reversed user flow that focuses on the key interaction – booking of the appointment by the visitor.
Here you can find a video tutorial on how to set up a reversed user flow:
This content is hosted by a third party (YouTube). By clicking the button below, you consent to loading the video.
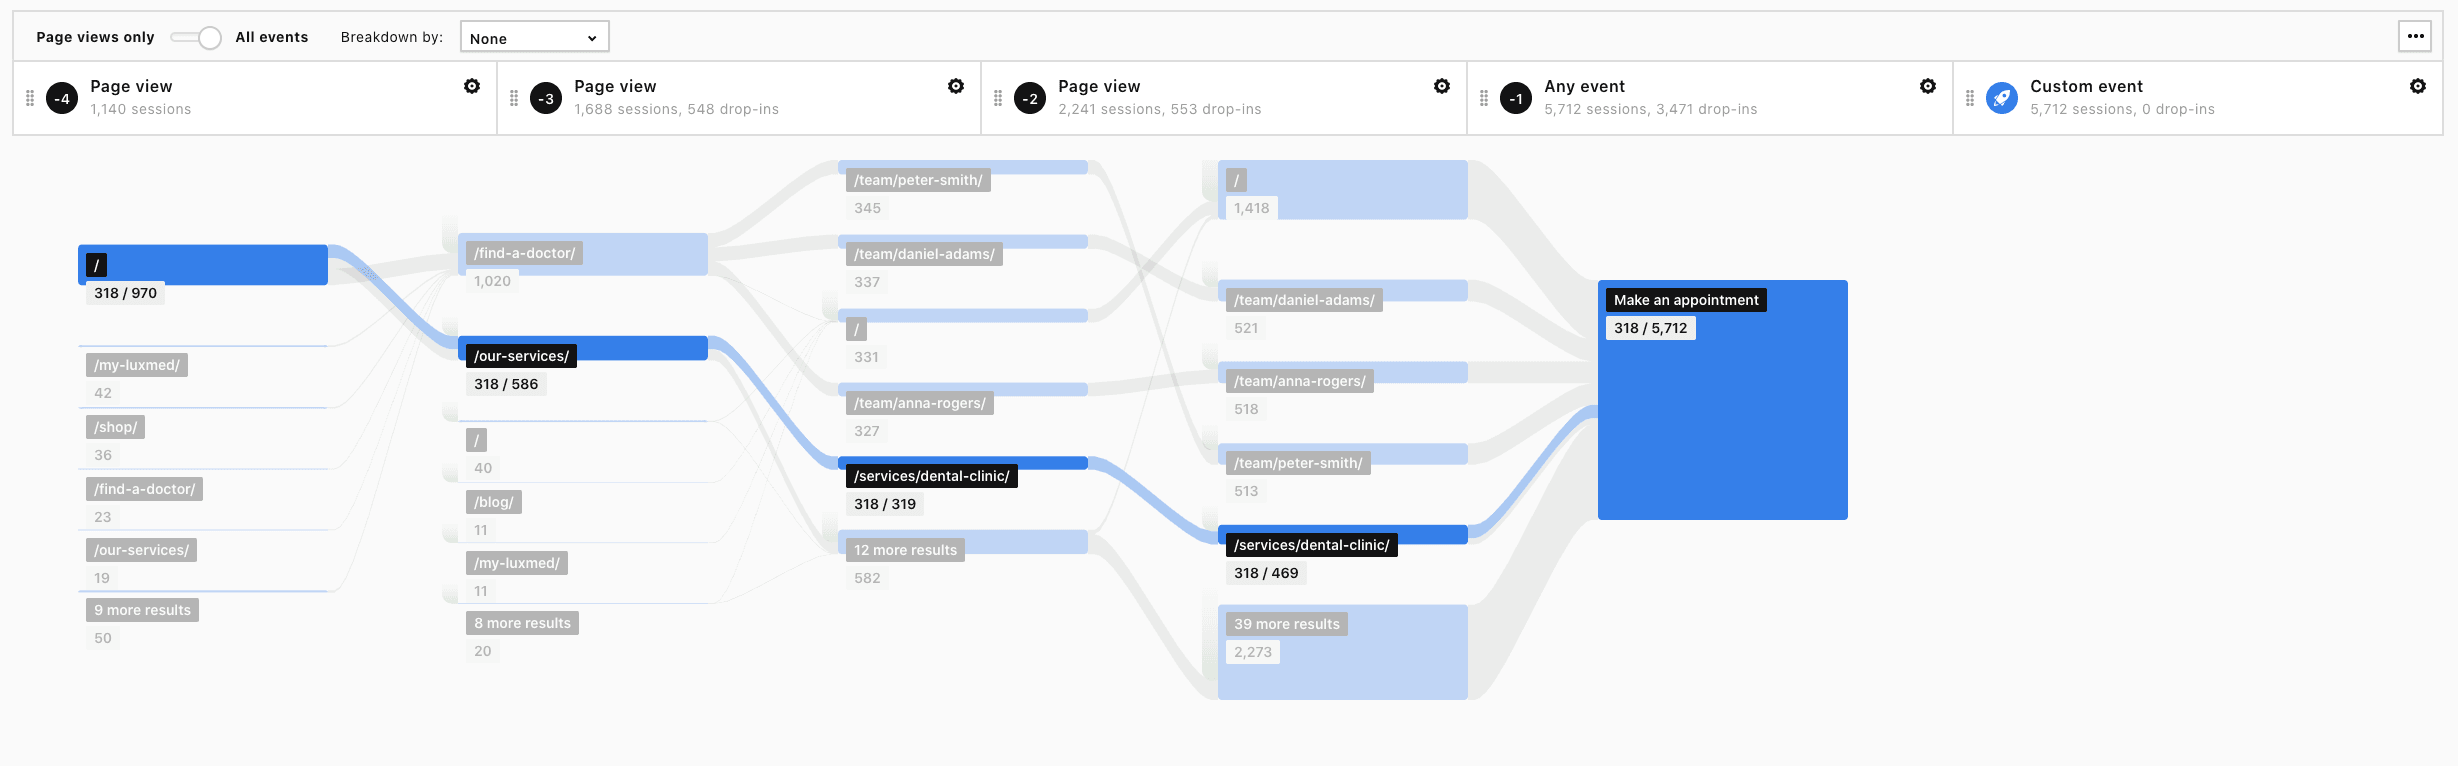
The finished report would look like this:
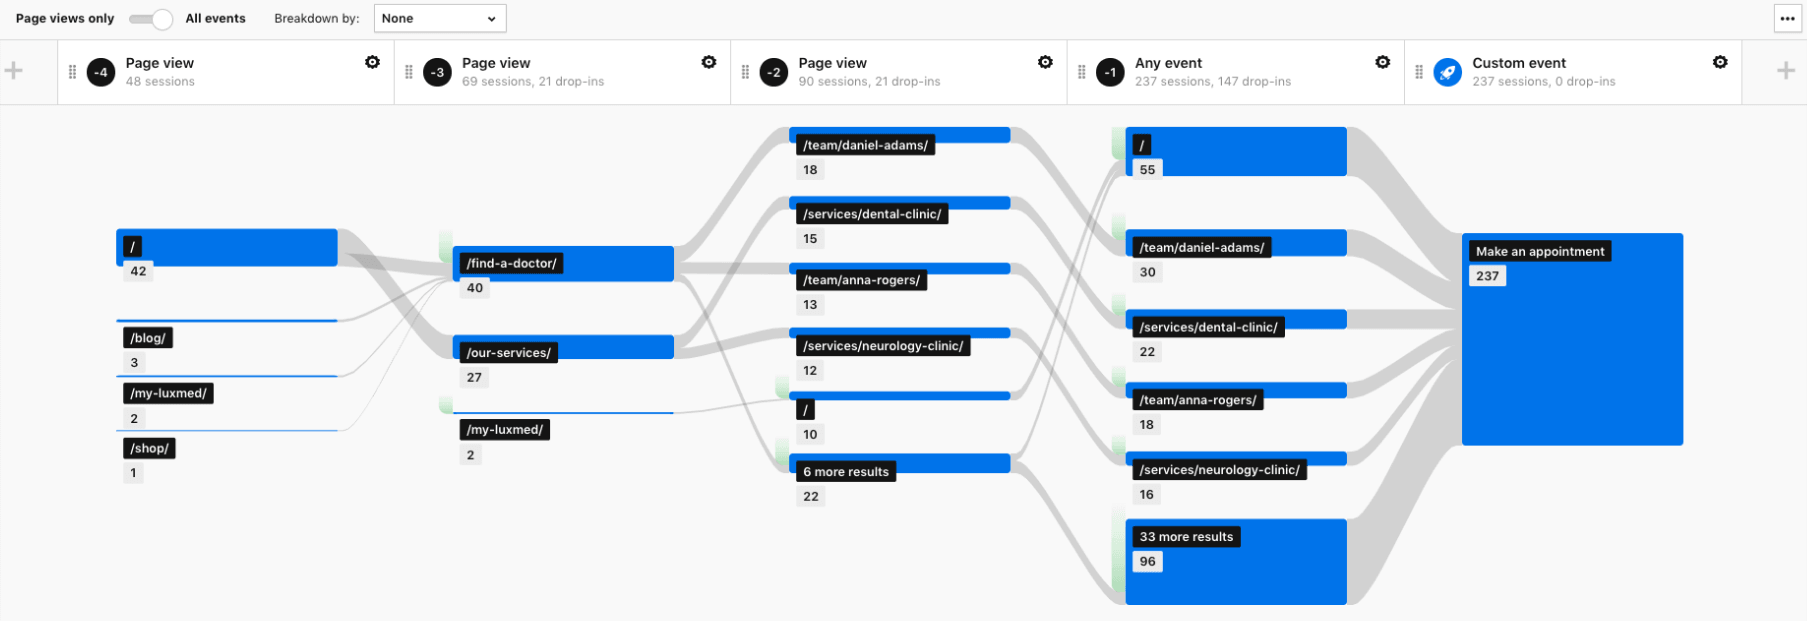
As you can see, in this case the key interaction is an event – a click on the Make an appointment button. The key interaction is preceded by the two most popular paths:
1) Visiting the Find a doctor page – this scenario takes the user across the main page where they can read about available doctors, through pages about specific doctors, and finally to booking an appointment:
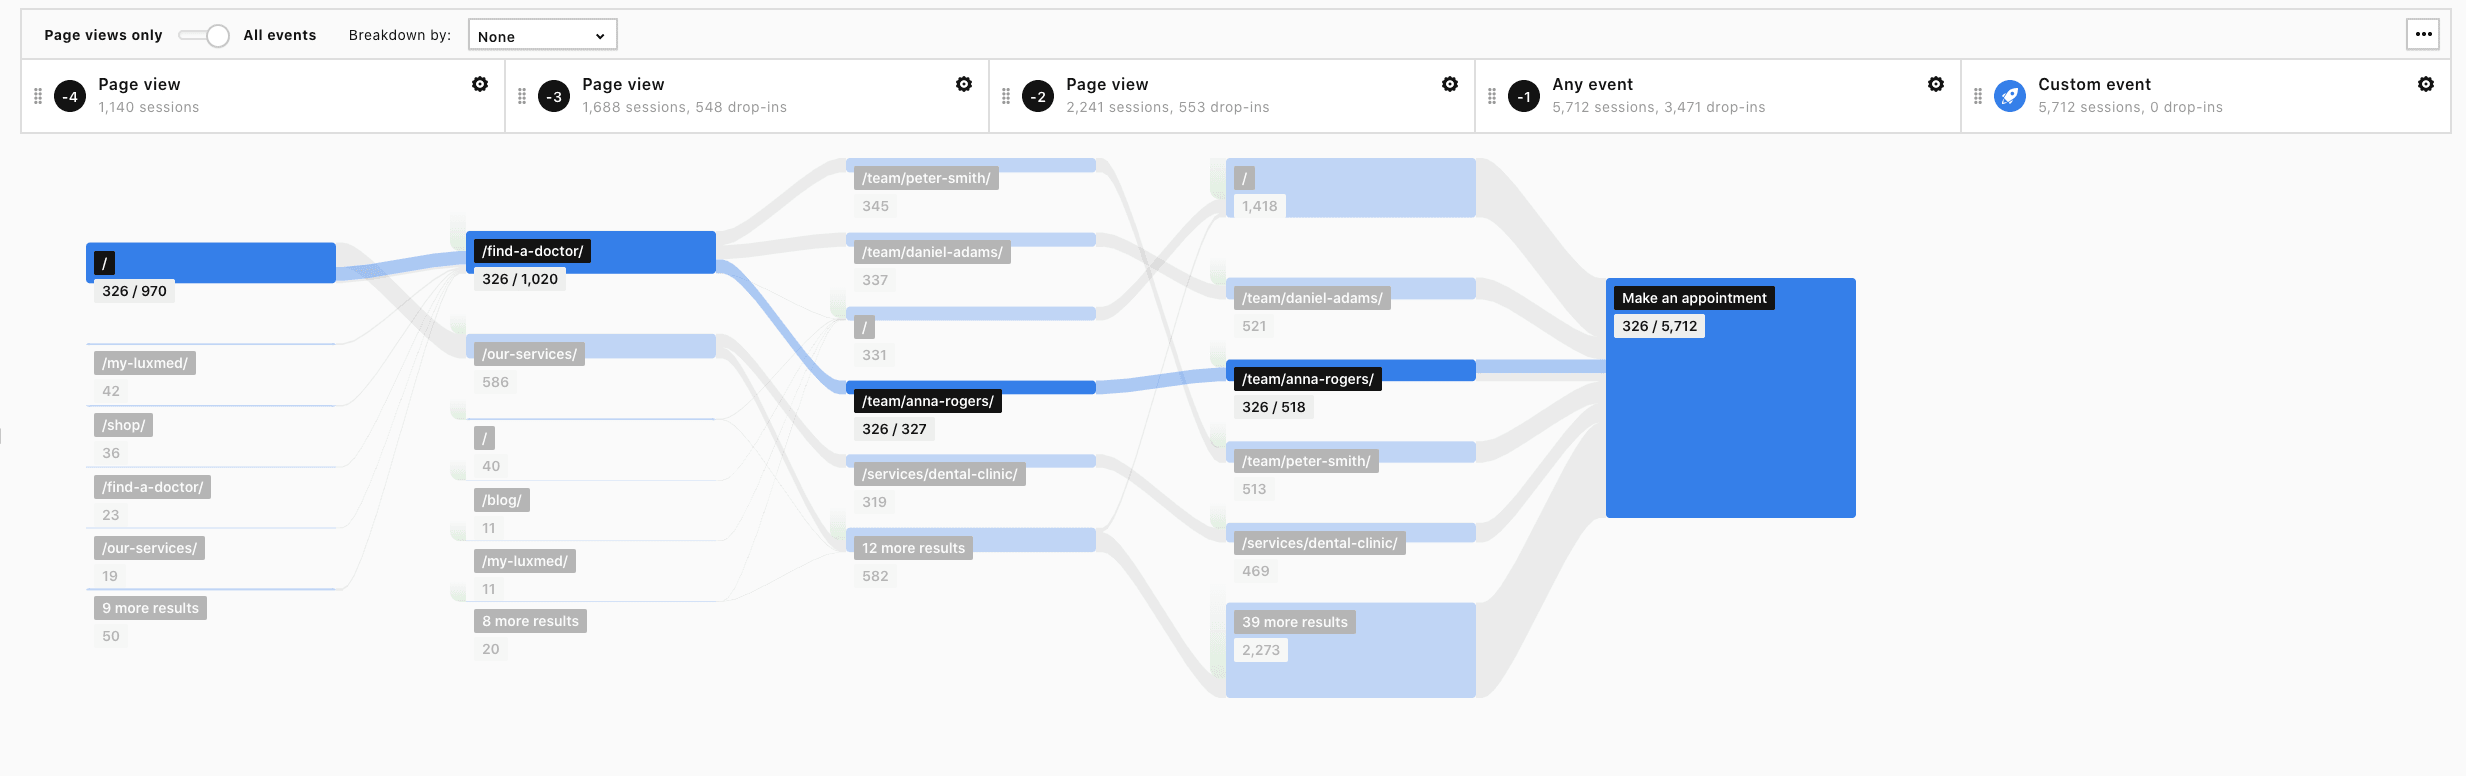
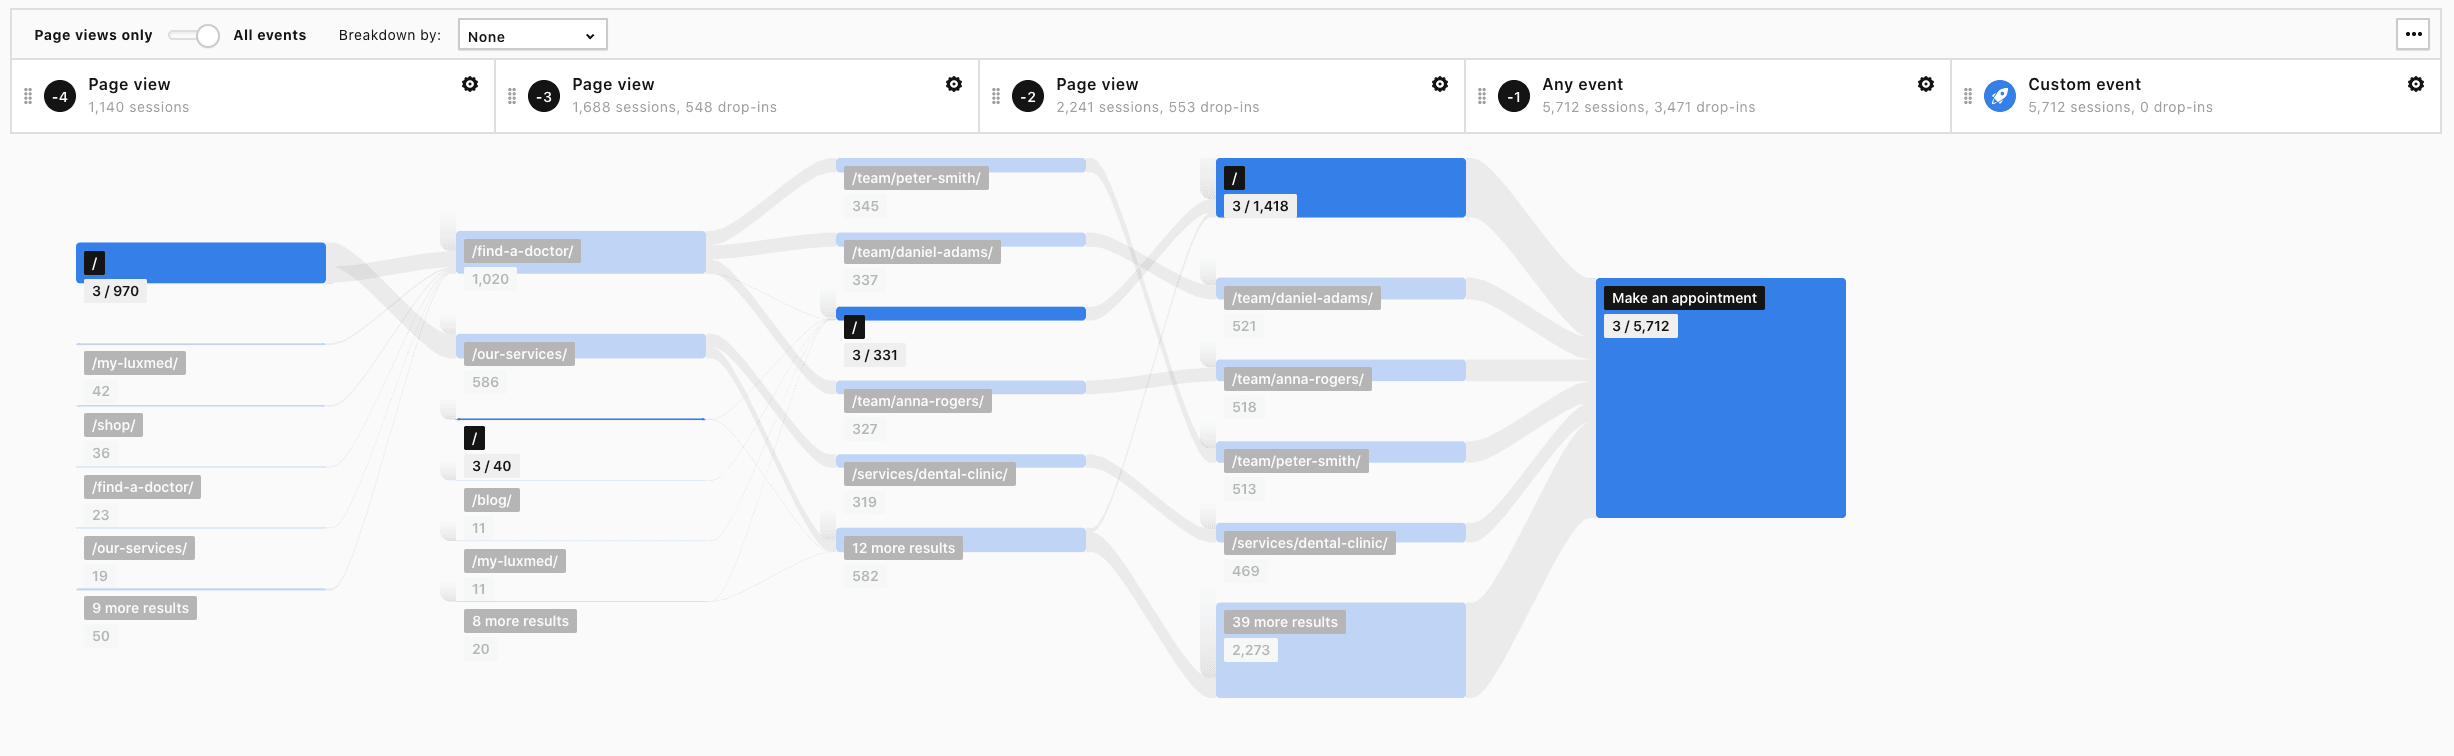
2) Visiting the Our services page – where users first get familiar with the pages that describe the specialities of the hospital’s clinics. Then some users read more about the specific doctors, and some move directly to the appointment booking process:
There is also an additional flow of a considerable group of users who book the appointment directly from the home page:
Tip: You can drill down into the data by using the Breakdown by feature, segmenting your visitors or applying additional filters. This way, you’ll be able to analyze the behavior of users with different devices and operating systems, or those coming from different channels, and spot more potential issues.
Read this blog post if you’d like to learn more about how Piwik PRO can help you enhance patients’ digital journey: Improve consumer experience in healthcare with analytics and personalization: 3 powerful use cases.
Transitions user flow – analyzing how employees use SharePoint’s internal search and what pages they visit next
Finally, let’s discuss a sample application of the transitional user flow report.
For this purpose, let’s assume that you want to know if the content of your intranet space is well optimized for internal searches. You’d like to make sure that everyone using SharePoint is able to find the information they’re looking for.
In this case, you could leverage the capabilities of the transitions user flow report with one additional step before the search takes place (so you know where visitors are when they decide to look for information using certain keywords).
The key interaction could be set to group the user interactions by the search keyword. You can also group it by the page URL dimension, which will reveal where the search occurs.
Here you can find a tutorial on how to set up a transition user flow:
This content is hosted by a third party (YouTube). By clicking the button below, you consent to loading the video.
On the finished report, you see how users navigate across the website after using the search.
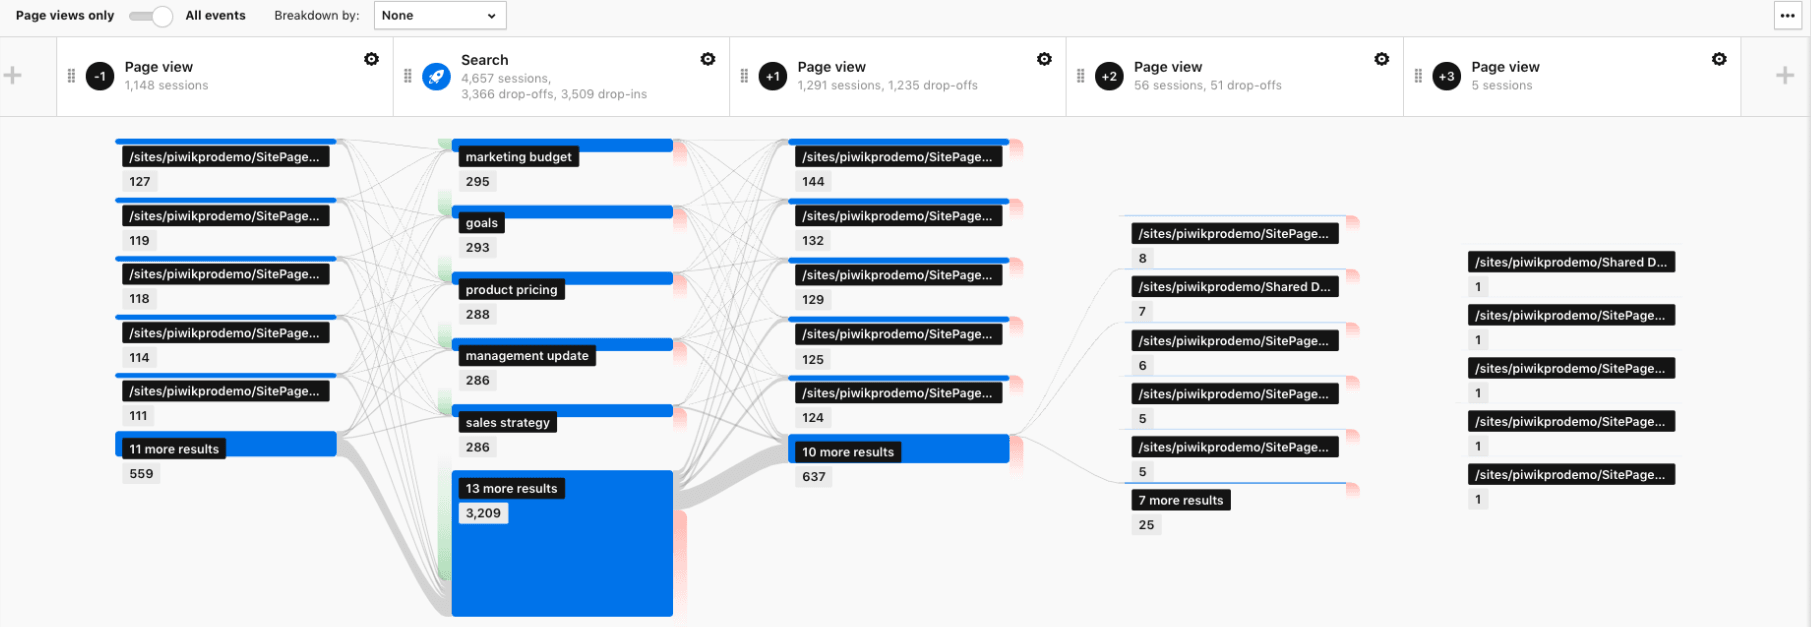
This allows you to analyze the most popular searches and the paths that follow them in one view.
Among other things, you can check if:
- The navigation of your intranet space is intuitional for users.
- The content related to the topics your employees are interested in is easy to find.
- The intranet space lacks any relevant piece of information.
If you’d like to learn more about tracking SharePoint with Piwik PRO, be sure to visit this page.
Final thoughts
Optimizing user flow is a process that involves multiple techniques and tweaks along the way. Visitors can move around your website in mysterious ways, so if you really want to help them reach their goals you need to rely on cold, hard data.
We hope that our examples will help improve your users’ journey. We would also like to let you know that these are just a few of the many applications of our user flow reports.
If you’d like to learn more about this topic or about other scenarios where these reports can prove useful, you can always reach out to us. We’ll be happy to answer all your questions.