
SUMMARY
- Real-time reporting in analytics refers to generating and delivering reports on data collected and updated in real-time. It enables businesses to instantly monitor their operations, performance, and key metrics, allowing for quick decision-making and timely actions.
- Real-time analytics is a game-changer for many businesses, such as publishers, ecommerce, ad agencies, and event-related companies.
- Real-time reporting has many use cases, including content performance, live traffic monitoring to improve marketing and ecommerce campaigns, product launches, and website implementation.
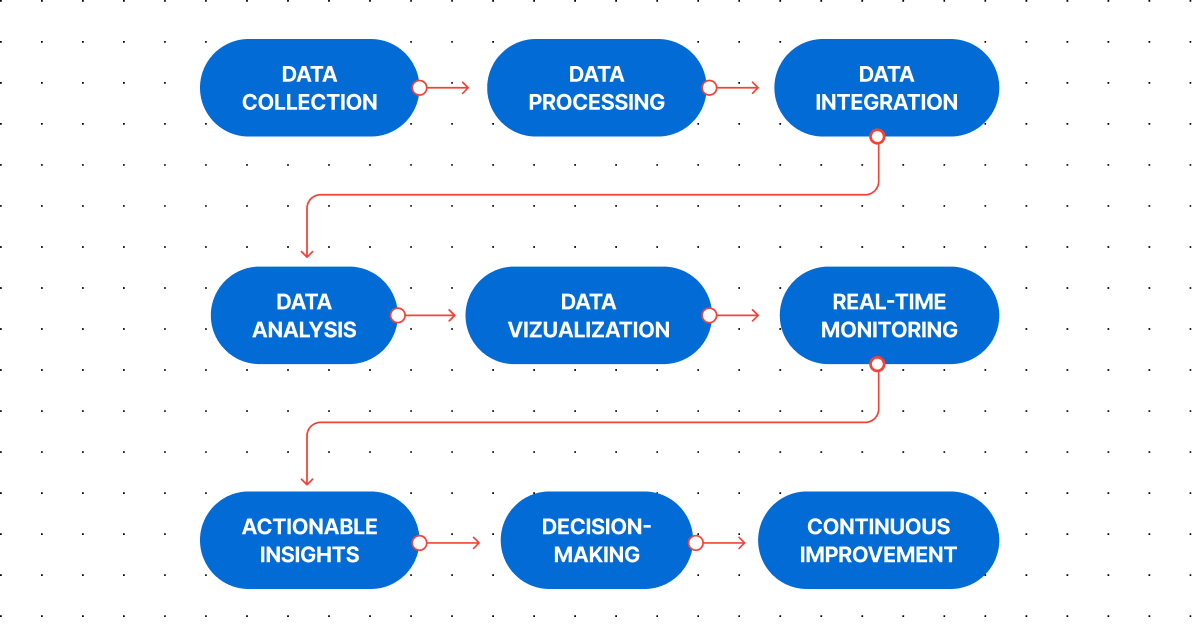
- Before diving into real-time data collection, processing, and analysis, consider key steps to prepare for your journey. These include: defining clear objectives, choosing the right analytics vendor, customizing dashboards for different users, and ensuring data quality and consistency.
Not every business requires the ability to access and act on data in seconds. That said, real-time and near-time analytics are increasingly necessary and growing in popularity. With real-time reporting, organizations can make fast and effective data-based decisions. By monitoring real-time data, you can streamline your operations, spot emerging trends, refine content strategy, boost sales, enhance marketing campaigns, and improve event management.
Whether you are new to real-time reporting or already use it and are seeking inspiration for more real-time data-based improvements, you’re in the right place.
What is real-time reporting?
Real-time reporting in analytics refers to generating and delivering reports on data as it is collected or updated on the spot. Real-time data reports can show how many people are visiting your website or using your app right now, what they’re interacting with, and what goals they are converting.
As a marketer or analyst, you can use this data to quickly respond to and dynamically manage the performance of your marketing content and campaigns or find anomalies.
Because real-time dashboards visualize the latest data available, they are also useful if you analyze time-sensitive information such as operational data, sales numbers, and inventory-related metrics and want to be up-to-date with the latest changes.
You can customize real-time dashboards to display the most important data and simplify day-to-day data management. The dashboard allows you to improve reporting by combining numerous data sources into a single view that can be shared with different teams and stakeholders across your organization.
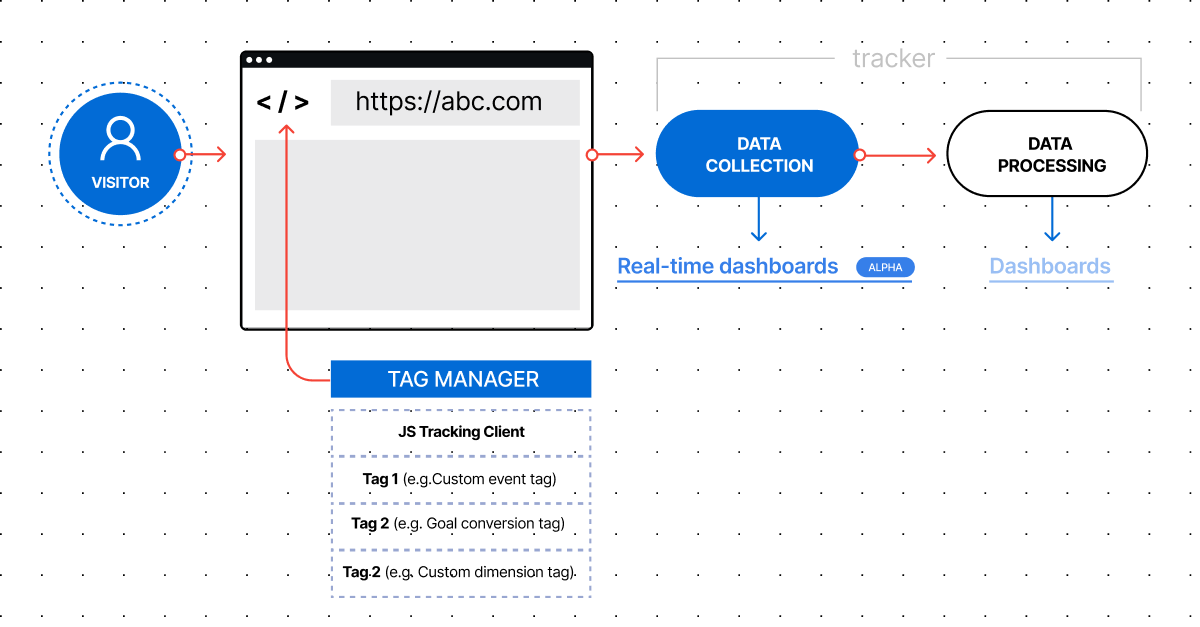
Real-time data collection and processing
Visitors come to the website, and the data is collected while they browse it. In real-time reporting, the data is partially processed and may lack some details as, for many visitors, the session is still pending. So, while we may not know session time, how many pages were viewed in a session, or what the time on the page was, we know what and how many events took place in a chosen time frame, such as 5, 10, or 60 minutes.
Benefits of real-time reporting
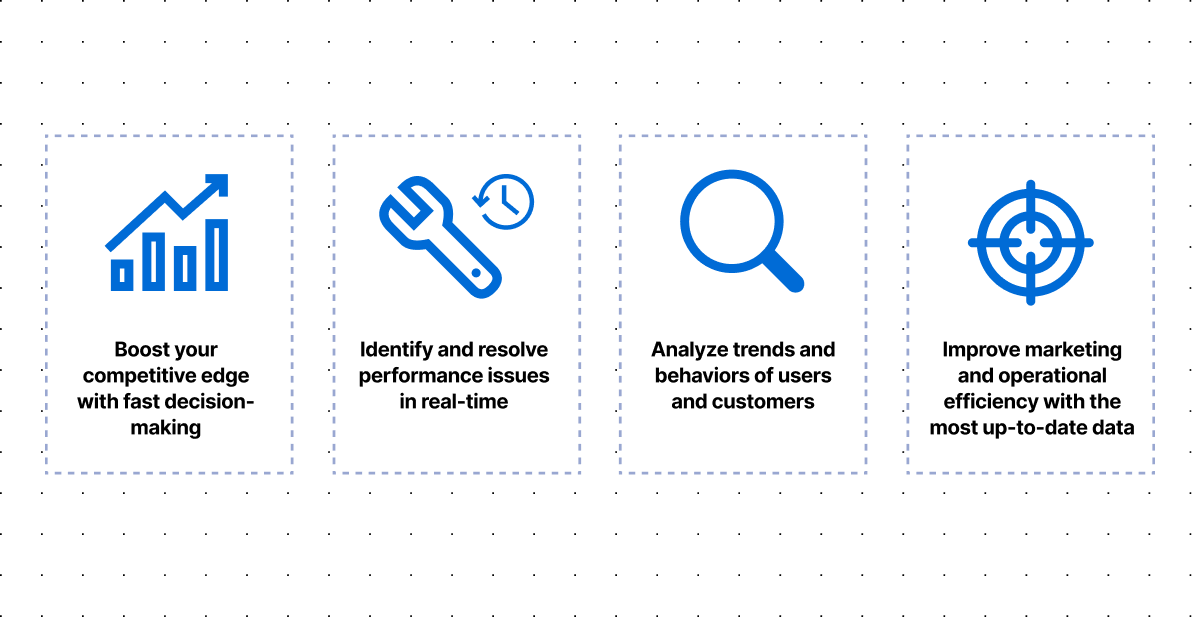
Getting access to real-time data allows you to:
- Improve your decision-making process to gain a competitive advantage: You can make more informed decisions, especially when dealing with time-sensitive cases. This also allows you to make timely decisions rather than waiting for monthly or quarterly reports.
- Keep track of the right KPIs: If your company operates in an industry where real-time data is crucial for assessing your performance (for example, you’re selling tickets for events or running an online magazine), getting access to real-time dashboards is simply a must.
- Detect anomalies to quickly solve problems: Any inconsistencies or variations, for example, in the campaign data, can be quickly identified, enabling prompt investigation and resolution of issues before they escalate.
- Improve the efficiency of your marketing campaigns: With real-time analytics, companies receive feedback almost immediately. This allows them to make more informed marketing decisions and ensures their campaigns are effective.
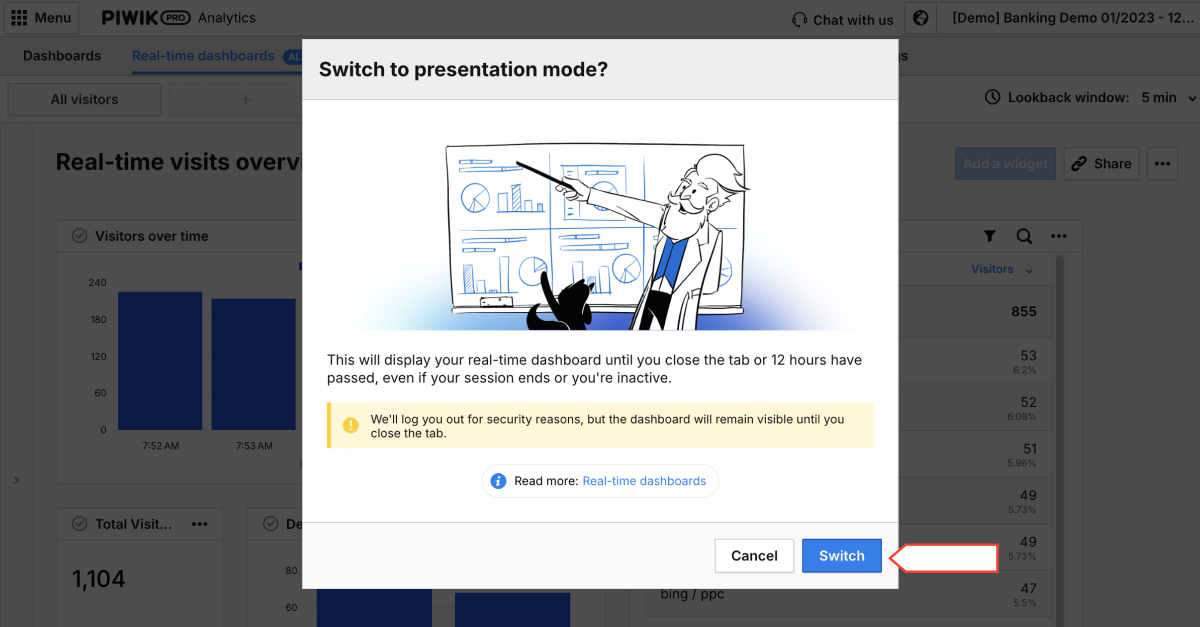
- Smoothen cooperation between departments: Most platforms that offer real-time reporting make accessing the data and reports easy for different people and teams. This allows you to share important data easily with others in the organization, ensuring all teams have the required information to be successful. Showing reports in presentation mode further facilitates data visualization and improves cross-team cooperation.
- Integrate analytics for better insights: With the use of a real-time API endpoint, you can export real-time data to third-party tools. Real-time web analytics data can be pulled to central reporting managed in a BI tool and combined with CMS metadata or video performance data, further enhancing your insights.

“Not all businesses need real-time reporting, but it is very beneficial for some use cases. It is very helpful when it comes to improving user experience (UX) and monitoring website traffic. Real-time reporting allows you to get instant insights and act on them quickly.”
Mehdi Oudjida
Freelance consultant in digital analytics
Learn more about real-time reporting and dashboards: Unlocking Real-Time Insights: How does Piwik PRO’s Real-Time Dashboarding Feature work?
What are the use cases of real-time reporting?
Real-time reporting is particularly beneficial in industries where timely decision-making is critical, such as publishers, ecommerce, event-related businesses, and ad agencies. It helps organizations from these industries stay responsive to changing conditions, identify emerging trends, and seize new opportunities.
Here are some of the most practical use cases for real-time reports and dashboards.
Experts opinion
Mehdi Oudjida
Freelance consultant in digital analytics
Based on my experience, I can definitely say that having access to real-time data is important when you:
- Run TV campaigns that cause significant spikes of traffic in your ecommerce store and want to keep tabs on your business and technical performance during that time.
- Plan to redirect a significant amount of URLs on your website and want to control the health of your web application and quickly detect any potential errors.
- Run an A/B test with 50% of the traffic redirected to the revamped version of your website to check how it affects your business performance.
Real-time data for improving content analysis
Collecting and processing data in real-time is more than a reporting method: it’s a game changer for content optimization. Without real-time analytics, media teams often struggle to decide what to change, when, and why.
If you are a publisher, understanding how your audience interacts with your content on different platforms, channels, and devices helps you optimize visitor engagement at critical moments for your site and fuels content analytics and content personalization.
Here are some examples of how real-time data can help you improve the performance of your content:
- If the content is trending, you can quickly create new posts and link to them from trending articles.
- If it underperforms, you can adjust the title, headline, and images to make it more interesting for your audience.
- You can test various headlines and quickly discover the most captivating one within seconds, as you receive instant real-time feedback.
- If your platform relies on advertisements, you can optimize the content thanks to real-time insights to keep visitors on the page for as long as possible.
Thanks to real-time dashboards, you can easily see and analyze who’s on your site, where they’re coming from, and how they interact with your content. This can significantly improve your content performance and make team collaboration smoother. Using real-time dashboards, you can maximize the benefits of real-time data for monitoring traffic and interacting with readers.
Real-time data to increase purchase rates and conversions
Data in real-time allows you to react swiftly to customer needs. Real-time data can help you get quick feedback on what works and what doesn’t work to attract new and returning customers. It also allows you to adjust instantly to evolving circumstances.
Businesses have a 60% to 70% chance of selling to an existing customer, while for a new prospect, it’s just 5% to 20% (Forbes, quoting the book “Marketing Metrics”)
If you run an ecommerce store, there are a few use cases:
- By looking at metrics such as the cart-to-detail rate and order-to-detail rate, you can dynamically change the presentation of products, especially for short-lived campaigns like Black Friday.
- You can see which ecommerce campaigns perform and which don’t and respond almost instantly to stop spending money on underdelivering ads.
For more details into ecommerce analytics in Piwik PRO Analytics Suite, watch the full episode of our masterclass
Finally, real-time reporting allows you to quickly spot market trends and shifts, enabling you to make better decisions that can enhance campaigns and inventory management, ultimately boosting sales.
If you want to learn more about ecommerce analytics, visit our ecommerce website or read:
Real-time data to optimize marketing campaigns
If you run multiple marketing campaigns, you need to be efficient and agile. By monitoring your campaign’s performance in real-time, you can immediately optimize it based on the insights provided by live data. You can see how the target audience reacts to campaigns in the moment. You can also analyze the number of visitors from a specific area, their peak activity times, and the advertisements, emails, and content that engage them the most.
If you want to learn more about marketing read:
Real-time reports will help you to:
- Ensure that campaign tracking is correctly implemented before you launch it.
- Quickly evaluate if your campaign is delivering the expected results by analyzing data in analytics.
- Change the targeting, messaging, or other characteristics of underperforming campaigns.
Campaign performance can be measured not only based on traffic but also on the number of conversions per channel or type of campaign. You can see the number of live conversions related to the channel/campaign. Keeping an eye on these conversion rates offers a useful way to analyze and compare the effectiveness of various advertising channels.
See how Piwik PRO’s real-time dashboard works:
This content is hosted by a third party (YouTube). By clicking the button below, you consent to loading the video.
Real-time data to monitor traffic on live online events
Real-time reporting is instrumental in live traffic monitoring. For example, real-time data transforms how events are managed. Collecting data in real-time lets you stay ahead and make informed decisions during live events.
Let’s see how real-time data can help you:
- If you are streaming a football match in real-time and looking to launch ads during the stream, monitoring live traffic allows you to adjust advertising during a game according to the traffic. Moreover, you can display real-time reports in presentation mode to the whole team to make their work smarter. This is particularly useful when displaying your dashboard on another screen or TV.
- Real-time data can also assist you in adjusting infrastructure when launching sales for popular events.
Real-time data to improve product launches
Starting a new product rollout is an exciting but intricate process that demands attention to every detail. Enhancing the product’s features and crafting a strong strategy are key to a successful launch, and tracking your product launch metrics is crucial in the process. You can measure product launch metrics in real-time to determine how close you are to achieving your predefined objectives during the launch.
During a product launch, you can also check whether everything is working, if there are any JavaScript errors, a significant drop in visitors or page views, or whether the data tracking (like the number of page views) is working correctly.
Here are some specific uses:
- You can track progress in real-time. If you aim to acquire 150 active users after launch, tracking the current number of active users will indicate your progress.
- You can instantly analyze your marketing efforts to identify which ones are effective and which are not. Whether it’s analyzing cost-per-click (CPC) in your advertising campaigns, engagement rates on social media, or conversion rates on your website, tracking real-time metrics reveals the effectiveness of your product launch marketing activities and allows you to make immediate improvements.
- You can monitor expenses related to marketing activities, payroll, and other factors in real-time.
Set up a real-time launch dashboard
Launch dashboards enable you to monitor and track your launch metrics in real-time. The results can be compared with your expectations and benchmarks to identify trends, patterns, and anomalies in your data. Furthermore, a launch dashboard assists you in communicating your launch performance to stakeholders and team members, allowing you to adjust your launch strategy and tactics accordingly. Data sources and tools can be connected to the dashboard through APIs or connectors.
Real-time data for better website implementation
A well-designed website launch is key to making a lasting impact on your users. And the process of launching a website doesn’t stop when you publish it. Whether you are creating a new website, updating an existing one, or merging two websites, you can utilize real-time data to monitor the website and guarantee smooth implementation. For example, you can monitor changes in trends in a short lifespan. If the number of visitors remains constant or decreases, it may indicate that the page is not functioning properly.
See how real-time analytics can help you:
- You can check if all the website’s features and functionalities are working as intended. Real-time reports can show the number of visitors and page views compared between desktop and mobile devices (in tables or a line chart to see changes in trends), which can indicate potential issues. You can track JavaScript errors under custom events, so it can be another indicator that everything is functioning correctly, and it can be compared between device types.
- You can check whether campaigns are tagged properly in reports instead of using a tracker debugger.
Real-time data to enhance UX
Good UX design can set you apart from competitors. In a market where consumers have many options, a website or app that offers superior usability can be a significant differentiator. By incorporating real-time analytics into your strategy for optimizing user experience, you can better comprehend user behavior, pinpoint areas of concern, and use data to improve the overall user experience.
Here are some specific uses:
- You gain valuable insights into your users’ preferences by closely observing how they interact with your website, including clicks and scrolling behaviors. These insights, directly from user actions, are crucial for adjusting your UX design to match current market trends.
- You can identify what captures users’ attention by tracking click-through rates (CTRs) for specific elements like banners and CTAs.
Tips for implementing real-time reporting
As you can see, real-time data has many applications and can benefit practically every organization. Before diving into real-time data collection, processing, and analysis, it’s important to consider a few key steps to prepare for this quest.
Here are some tips for effectively implementing real-time reporting:
- Define clear objectives: Clearly define the goals and key performance indicators (KPIs) you want to monitor in real-time. Identify the specific metrics and insights that will be most valuable for driving decision-making.
- Select the right analytics vendor: Choose the right vendor for handling real-time data processing and visualization effectively. Consider such features as access to the metrics and dimensions that you need, segmentation possibilities, customizable real-time reporting, integrations with other products like PowerBI, ease of use, and competitive pricing.
- Ensure data quality and consistency: Prioritize data quality and consistency to ensure the insights derived from real-time reporting are accurate and reliable. Implement data validation processes and quality checks to detect and address any issues with data integrity.
- Customize dashboards for different users: Create customized dashboards tailored to the specific needs and roles of different users within the organization. Provide relevant insights and visualizations that empower users to make informed decisions quickly and efficiently.
- Continuously improve and perfect: Continuously refine your real-time reporting processes based on feedback, changing business requirements, and technological advancements. Regularly assess the effectiveness of your real-time reporting implementation and make adjustments as needed. This is aided by easy-to-use customization options.
- Align with business strategy: Align your real-time reporting initiatives with the organization’s broader strategic objectives and priorities. Ensure that real-time insights support decision-making processes that drive business growth, improve customer experiences, and enhance operational efficiency.
By following these steps, your organization can deploy real-time reporting capabilities that enable decision-makers to access timely and actionable insights for driving success.
How to choose a real-time reporting analytics platform?
You may be considering integrating real-time analytics into your strategy, or you may already be using an analytics vendor that offers real-time reporting features, but you want a more user-friendly and customizable platform.
“Real-time is not an exception when it comes to adhering to good principles. Like any measurement plan, it should be specific, reflecting the business, functional, or technical data requirements for the relevant digital device to follow. Providing a fixed view with basic dimensions and metrics is just a gadget. Getting access to relevant dimensions and metrics covering all standard fields is an excellent first step. It’s also essential to have the freedom to design your real-time reports.”
Mehdi Oudjida
Freelance consultant in digital analytics
Whatever your motivation, choosing an analytics platform with real-time reporting features requires careful consideration of your organization’s specific needs, goals, and technical requirements. Having this in mind, you have to evaluate the real-time capabilities of the analytics platform and its visualization possibilities, including its ability to process and analyze data in real-time, the latency of its reporting and dashboarding features, and the availability of user-friendly and customizable dashboards. Ensure that the analytics platform can integrate seamlessly with your existing systems and tools and fully support your data-driven strategies for decision-making processes.

“Real-time data can be a game-changer if used correctly. Piwik PRO’s new real-time dashboard feature, even in its alpha version, is already showing promise. I love creating interactive dashboards without being concerned about data sampling problems. It’s straightforward for beginners and robust for advanced users, offering fast solutions without a complex learning process.
This feature allows you to create interactive dashboards from scratch. You can add various filters and visualization types to compare segments side by side. While real-time data is valuable, it comes with challenges. If you have large amounts of data streaming in, it can be overwhelming to identify what’s important. Always seek tools that enable you to use a lookback window to isolate specific time instances you wish to review.”
Juliana Jackson
Mobile Apps, Product & AI. Content Creator
You should also consider your organization’s security and compliance requirements. Look for features such as data anonymization, safe hosting options, and compliance with applicable regulations like GDPR and HIPAA.
Piwik PRO Analytics Suite provides real-time reporting capabilities and is distinguished by:
- Flexibility: Built on our powerful dashboard engine, allowing you to enjoy many customization options.
- Data freshness: Data is refreshed every 10 seconds.
- Lookback window: From 5 to 60 minutes.
- Segmentation: Analyze specific segments of your data and compare them effortlessly for deeper understanding and actionable insights.
- Real-time data API: Integrate our dashboards with your existing systems for a truly unified experience (e.g., data can be taken into PowerBI).
- Integrations: Easily analyze and activate your data thanks to the integrated modules.
- High privacy standards: Remain compliant with privacy regulations around the world.
Piwik PRO’s real-time dashboards enable you to comprehend customer behavior, monitor campaign performance, track live traffic, enhance product launches, and adapt strategies promptly. It’s also valuable when it comes to monitoring the website and guaranteeing its smooth implementation.
Reach out to us to discover the full potential of Piwik PRO as an integrated analytics platform offering real-time reporting capabilities
FAQ
Real-time reporting refers to delivering information or updates instantly or with minimal delay as events occur. Journalists and data analysts use it to deliver news, updates, or insights immediately after they happen. This can involve live broadcasts or continuous updates on websites.
Real-time data is information collected, processed, and made available immediately or with minimal delay after creation. It reflects the current state of a process or environment, allowing users to monitor events as they happen. This data is often generated by analytics platforms and can have various use cases, such as monitoring live website traffic, ad campaigns, events management, etc. Real-time data is valuable for decision-making, analysis, and responding promptly to changing conditions.
Real-time analytics empowers organizations to harness the power of data in real-time, driving faster decision-making, improving operational efficiency, enhancing customer experiences, and gaining a competitive edge in the market.
Real-time data can provide a wide range of information, allowing you to monitor, analyze, and respond to events as they unfold in real-time across various channels. It can reveal trends and patterns as they emerge, giving you invaluable insights into your users’ behavior.
Piwik PRO offers real-time reporting capabilities to track website visitors and activities as they happen. Here’s how real-time reports work in Piwik PRO:
1. Data collection: Piwik PRO collects data about website visitors’ interactions, including events like page views, custom events, conversions, and more, using a JavaScript tracking code installed on the website.
2. Real-time processing: As visitors interact with the website, their actions are sent to Piwik PRO’s servers in real-time. Piwik PRO processes this data immediately and updates the real-time reports accordingly. Real-time data is processed partially. Final processing is done after the session ends.
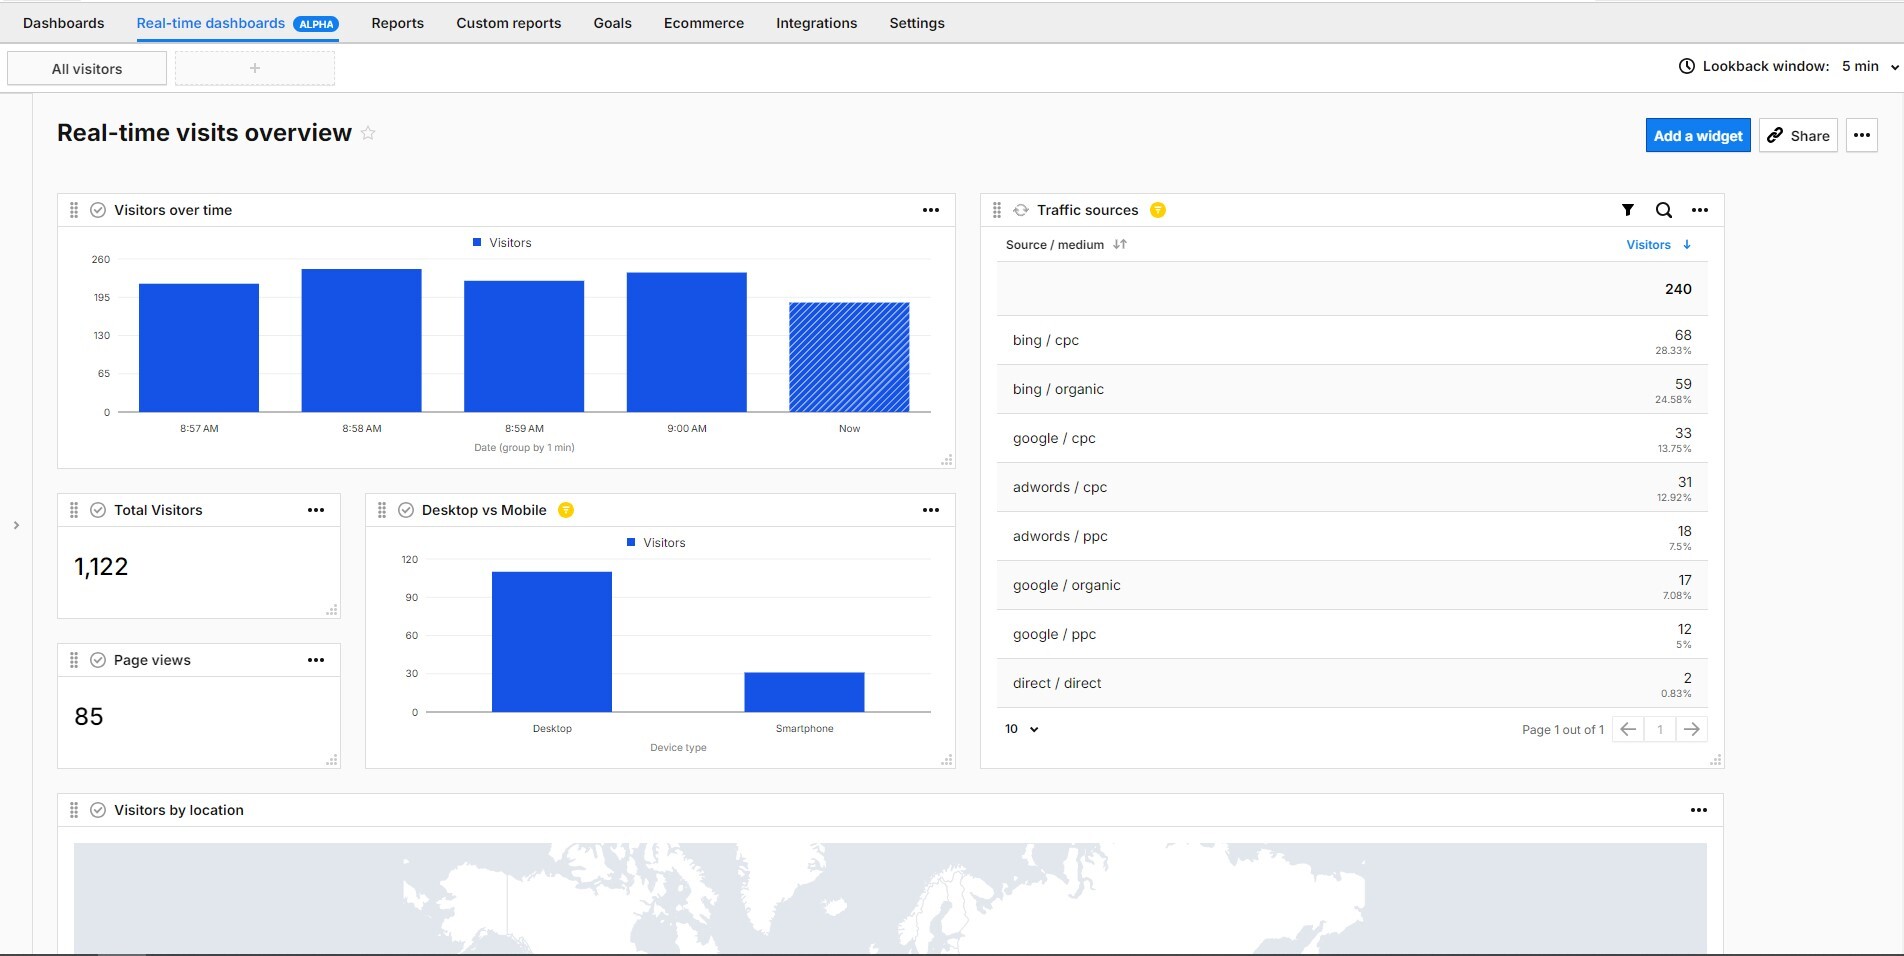
3. Dashboard: Piwik PRO provides a real-time dashboard that displays key metrics and insights about current website activity. This dashboard is continuously updated to reflect the latest visitor interactions.
4. Metrics: The real-time reports in Piwik PRO include metrics such as the number of active visitors, pages being viewed, referrers, keywords, and events triggered in real-time.
5. Customization: Users can customize real-time reports in Piwik PRO to focus on specific metrics or segments of website visitors. They can create custom dashboards to be notified of significant events or changes in real-time.
6. Integration: Piwik PRO’s real-time reporting can be integrated with other analytics tools, marketing platforms, or data visualization software to create comprehensive analytics workflows and gain deeper insights into website performance. Read more in our Developers resources: Raw events in real-time, Real-time reports.
Real-time reports in Piwik PRO provide users with immediate visibility into website activity, allowing them to monitor visitor behavior, track campaign effectiveness, and make timely optimizations to improve website performance and user experience.