SUMMARY
- Ecommerce analytics focuses on collecting and analyzing data from online stores to inform business decisions, track customer journeys, and optimize marketing strategies.
- Businesses are able to track data and gain detailed insights into their store and customers, such as audience demographics, acquisition channels, customer behavior, and product performance.
- Data activation is essential for maximizing the benefits of ecommerce analytics, leading to improved user experience and more sales.
- To benefit from their data, businesses must, among others, take a holistic approach to their customer journeys, define their KPIs, integrate data sources, and adjust data for seasonality and trends.
The global ecommerce market is expected to be worth $6.3 trillion in 2024 – up from $5.8 trillion in 2023. This continuous growth makes ecommerce one of the most competitive industries. The heightened competitiveness has pushed businesses to find ways to gain an edge over their competitors. The best option they have is turning to what’s readily at hand – vast amounts of data shared by customers.
A thorough grasp of the large data volumes generated by customer activity in your ecommerce operations is critical to determining what works for customers and what doesn’t. This is especially important given that the average cart abandonment rate for online shopping exceeds 70%, presenting both a massive challenge and opportunity to ecommerce strategies.
Ecommerce analytics empowers you to better understand your customers’ actions and increase profits. The key is to collect the right data, draw granular insights about your audiences, and put those insights to work. With this powerful tool at your disposal, you have the control and capability to steer your business towards success.
Today, we will discuss using ecommerce analytics to create more effective campaigns, increase sales, and strengthen your brand’s position.
What is ecommerce analytics
Ecommerce analytics involves collecting and analyzing data from an online store to inform business decisions. This process consists of tracking different aspects of the customer journey, including discovery, acquisition, conversion, retention, and advocacy.
These metrics relate to sales, customer behavior, and site performance, providing insights to optimize marketing strategies, improve customer experience, and increase revenue. By gathering and analyzing data from multiple sources, ecommerce businesses can understand their store’s performance and identify the business aspects they should optimize.
Unlock the power of your Shopify store with Piwik PRO
Drive smarter decisions with Piwik PRO’s Shopify app. Track customer behavior, product interactions, and sales performance with ease, without the hassle.
The app simplifies setup, ensures GDPR-compliant data collection, and integrates seamlessly with your Shopify store. Gain valuable insights that help you optimize your ecommerce business and stay ahead of the competition.
Why is ecommerce analytics important
Ecommerce analytics gives businesses the tools to apply business-specific insights to their processes and keep growing in the highly competitive and continually evolving ecommerce industry.
They can use the collected data insights to:
- Understand which channels bring the most customers and optimize their marketing budget and investments accordingly.
- Learn which customer groups spend the most money and what they typically purchase, and target them with custom offers.
- Discover which customers are least likely to make a second purchase and why, and develop an appropriate customer retention strategy.
What types of data can you analyze through ecommerce analytics
Ecommerce analytics allows you to gain insight into different aspects of your business:
Audience
Data about your audience helps you understand your target group’s demographics and interests. You can connect this information with your customers’ behaviors and tailor your offers to their needs, making them feel valued and understood.
Your audience data may consist of the following information:
- Income
- Occupation
- Geographic location
- Languages spoken
- Device
You can use this data to:
- Fine-tune your customer persona and determine the pain points you need to address.
- Plan and adjust your shipping options and ads based on your audience’s locations.
- Offer product recommendations based on your audience’s device type.
Audience reports in Piwik PRO are divided into a few sections:
- Overview: A summary of audience metrics, including the total number of orders, overall revenue generated, and the value of abandoned carts.
- Session log: Details of individual shopper sessions, including duration, page views, and actions taken.
- Devices: Categorizes the audience based on the devices they use to access your online store.
- Countries: Insights into the geographic distribution of the audience, helping you understand your international reach.
Acquisition
Acquisition data informs you about the sources and channels that bring traffic to your online store and result in conversions. You can learn how visitors discover your business, which lets you improve your marketing strategy and attract more potential buyers.
Here are some customer acquisition metrics to keep in mind:
When using acquisition data, you can discover which marketing channels drive the most traffic and lead to the highest conversions and sales. You can see which online marketing channels are the most effective and which aren’t working. This data is crucial in understanding where to focus your resources and what future campaigns to plan.
Acquisition reports in Piwik PRO are divided into a few sections:
- Channels: Insights into the various sources and channels that drive traffic to your online store.
- Landing pages: The performance of different landing pages, including conversion rates and engagement metrics.
- Campaigns: The effectiveness of marketing campaigns in terms of click-through rates, conversion rates, and ROI.
- Attribution: The impact of each marketing channel or campaign in driving conversions.
Behavior
Insights on customer behavior open up a world of opportunities. They let you deep-dive into shoppers’ actions and interactions in your online store, shedding light on shopping stages, product preferences, and loyalty. You can measure and analyze purchase data to learn when and how your audience members tend to convert. Behavior analytics also helps you discover how to improve user experience to boost engagement and conversion rates.
Some metrics you can track here include:
- Sales conversion rate
- Average order value (AOV)
- Cart abandonment rate
- Revenue
- Cost per conversion
- Return on ad spend
Here are some questions you can ask to get an idea of your customers’ behavior:
- When do visitors tend to drop off from their journeys?
- How many viewers leave your website straight away?
- What pages do people visit first after landing on your site?
- What marketing content do users consume the most?
- Which products get a lot of traffic but few sales?
- Which products bring the most revenue?
- How long does a typical shopper take before they make a purchase?
- How often does each shopper buy from your store?
- How many customers abandon their shopping carts?
Behavior reports in Piwik PRO are divided into a few sections:
- Shopping behavior: A funnel-based report that helps analyze the customer journey from product discovery to purchase and spot drop-off points.
- Shopping stages: Depicts shopper behavior throughout the shopping process, identifying potential areas for improvement.
- Days and Sessions to Order: The time and engagement required for customers to complete a purchase, providing insights for optimizing the conversion journey.
- Orders: Detailed order data, including revenue, tax, shipping, discounts and product quantity, to identify trends in customer purchasing behavior.
- Products: Insights into the performance of specific products, such as orders, revenue, click-to-detail rate and order-to-detail rate, guiding product optimization and marketing strategies.
- Customer loyalty: Metrics such as days since last order, order value, and product quantity to identify loyal customers and develop strategies to enhance their long-term value.
Ecommerce features in Piwik PRO
In 2023, we launched a new ecommerce setup with several enhancements to improve your online store’s reporting.
Apart from dedicated ecommerce reports, your store can benefit from other useful features:
Product scope
Product scope is available in all reports, including custom reports, web APIs, and raw data, in addition to the session and event scopes. Product scope lets you use dimensions and metrics related to products to give you more precise reporting and a deeper understanding of your product performance.
New dimensions and metrics
You can benefit from several new dimensions and metrics that will help you better analyze your online store data. For example:
- Product detail views show how many times shoppers viewed the product detail page.
- Cart-to-detail rate shows how product details affect cart additions.
- Order-to-detail rate shows how product details affect product sales.
Introducing Currency Conversions: Unified revenue data for smarter global analytics with Piwik PRO! Learn more from our article.
Sample use case for order-to-detail rate
The order-to-detail rate is calculated as Orders / Product detail views * 100%.
You can compare it for various products based on their details.
If the rate is low, meaning there are many product detail views but few orders, you may need to improve the product images, adjust the description, or make other changes.
Or, you may see that the rate is higher for a specific product color, suggesting that you make that product version the principal one.
See the complete list of ecommerce dimensions and metrics.
How can your business benefit from ecommerce analytics
Ecommerce analytics will show you trends and patterns in data, allowing you to:
- Understand your customers’ interests and product preferences – With this knowledge, you’re able to optimally position your products and support customers’ purchasing journeys. It also lets you optimize your inventory and influence your marketing efforts.
- Optimize pricing and inventory – You get a granular picture of what drives pricing for every consumer segment. Use this insight to discover the best price points at the product level rather than category level and gradually increase revenue.
- Measure the effectiveness of marketing campaigns – You can gain detailed insight into your marketing performance across channels. This lets you monitor all your campaigns and react quickly to adjust your activities if needed.
- Improve customer retention and loyalty – You can analyze customers’ past behaviors and purchases to better understand their interests and the choices they make when they buy your products.
Experts opinion
David Culbertson
CEO at LightBulb Interactive
I deal with small businesses, several of whom have Shopify-based ecommerce websites. While Shopify offers a decent analytics toolkit, it’s very limited compared to a robust analytics solution with a wide variety of metrics; it’s like looking at a website through a keyhole.
When choosing an analytics solution, my clients face many challenges, including:
- Price sensitivity (they’re used to free).
- Lack of expertise to interpret reports.
- Concerns about data accuracy.
In a crowded marketplace, finding the analytics solution that can address those challenges can be bewildering. Luckily, I’ve been able to guide my clients to Piwik PRO which solves many issues and gives them peace of mind.
How to analyze and improve the performance of your ecommerce store
The details of what data you collect and analyze will largely depend on your business goals and the specifics of your company.
Below, we present a sample process for gathering insights that would become a foundation for more in-depth analyses.
Acquisition
The acquisition report gives you a base for exploring your data by providing an overview of channel and campaign performance. It will help you understand how users find your website and how they behave.
Here are some questions you can try to answer while looking at the data:
- What is the split between different traffic sources?
- Which sources bring in the most traffic?
- What keywords do people use to find your website?
pro tip
You can dive deeper into user behavior on your website and consider the following aspects:
- What’s the first thing people tend to do after landing on your website?
- What are the typical paths that users take from the homepage to other pages?
- How long do users spend on the website? An average engagement time of one to three minutes may indicate their intent to explore the page further or make a purchase.
- What is the ratio of new vs. returning visitors? If you’re not retaining many visitors, you need to find out what’s stopping them from coming back.
- What category, product or other types of pages do users visit the most and how do they interact with them? This can help you identify the most engaging pages and understand where the purchasing process begins.
Channels
You can now see in more detail how people from different channels behave and go through the shopping process.
For each channel, analyze metrics like:
- Bounce rate
- Cart abandonment rate
- Total revenue
- Average order value (AOV)
- Product detail views
- Cart-to-detail rate
- Order-to-detail rate
pro tip
Aside from analyzing these key metrics, consider the following questions:
- How do purchases typically happen? When and on which pages do people tend to make a purchase?
- What is the ratio of orders by new vs. returning visitors? Check this data for different countries or regions, especially when evaluating ad campaigns.
- What products are the bestsellers?
- How often do customers take advantage of discounts or promo codes? You might miss out on revenue opportunities if they use discounts too frequently.
- How often do transactions happen? How many days typically pass between orders?
With this analysis, you can determine which channels bring the most revenue and which are underperforming. You may discover channels with hidden potential, giving you an idea of the types of campaigns you should invest in more.
For example, you may find that email brings the highest average order value despite having the lowest number of visitors. Consider allocating more resources to email campaigns or broadening your email audience.
Landing pages
Another aspect is landing page performance.
For each landing page, analyze the following metrics:
- Number of page entries
- Bounce rate
- Order rate
- Cart abandonment rate
- The sum of revenue
- Average order value (AOV)
For example, you may find a product landing page with many entries that has a high bounce rate, low order rate, and low revenue.
To investigate the possible causes, determine which channels bring the most traffic to this page. If it’s paid campaigns, review the different aspects of ad configuration and assets you should adjust – such as product descriptions, images, alignment between the ad and the landing page, and so on.
Paid campaigns
Next, evaluate the performance of paid campaigns to assess whether the revenue is higher than the ad spend.
For each campaign, check metrics such as:
- Cost
- The sum of revenue
- Average revenue
- Return on ad spend (ROAS)
Product categories
Additionally, you can find out which channels drive traffic to specific product categories.
For each product category, check:
- Channels
- Sessions
- The sum of product revenue
The complete Piwik PRO Shopify app playbook
Tap into advanced analytics and a built-in customer data platform (CDP) to improve your Shopify store’s performance. This playbook offers actionable strategies, real-world examples, and step-by-step instructions to help you grow your business while staying compliant with global privacy laws.
Shopping behavior
The next step involves analyzing customer journeys on your website.
For example, in Piwik PRO, you could create a funnel to get an overall picture of the shopping behavior:
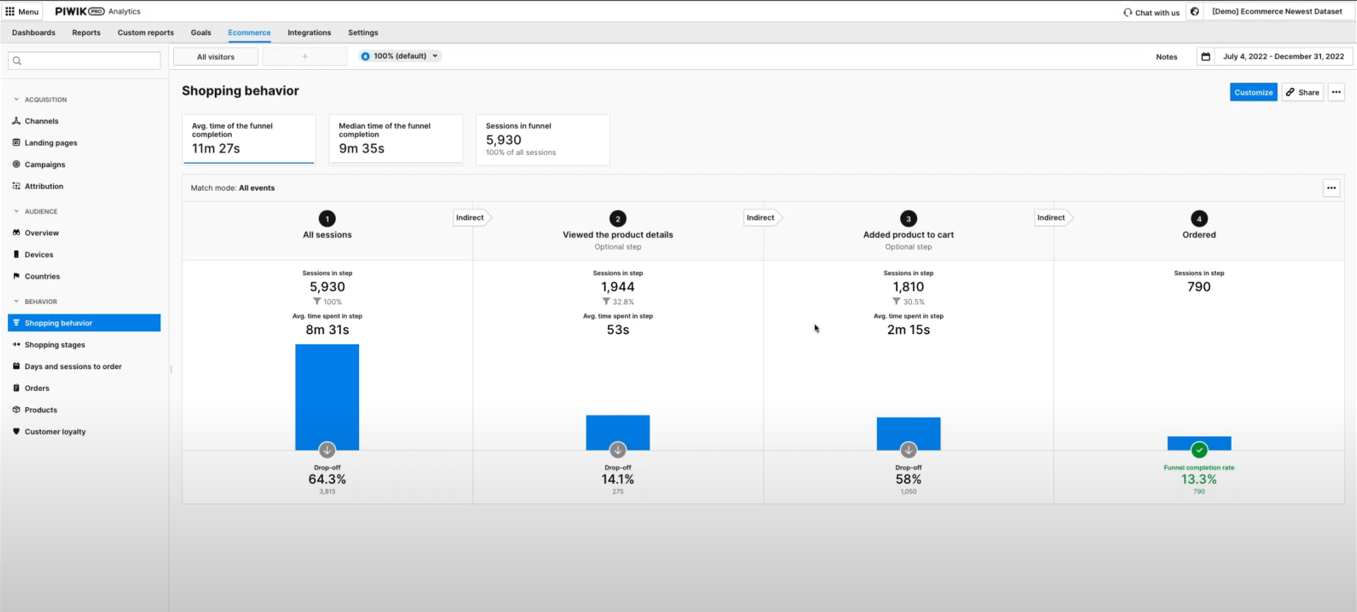
Focus on analyzing the number of users who drop off at each step. To benchmark, you can compare the current numbers with results from the previous period.
For example, you may discover that many people leave after adding a product to their cart. You should then investigate the reasons for the increased cart abandonments.
For that purpose, evaluate the pages users visit before abandoning their carts. If they abandon their carts while on the checkout page, it may indicate the page is difficult to navigate or lacks usability.
You can dig deeper into the checkout process by analyzing a sample funnel report showing the checkout steps:
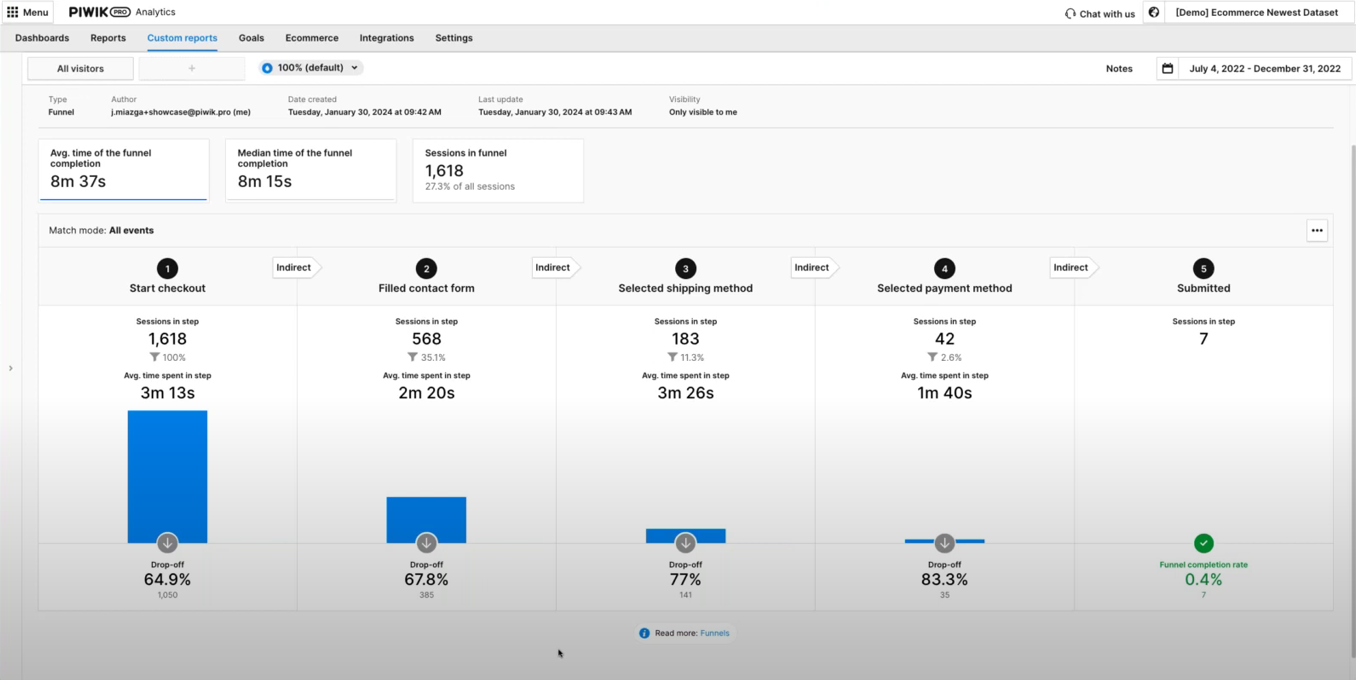
This will allow you to analyze the drop-off points and learn which ones create friction.
Additionally, you can optimize your product pages.
One point of your analysis could be checking the number of product detail views and order-to-detail rates.
For example, a product page that gets a high number of product detail views and a low order-to-detail rate indicates an issue. Analyze your heatmaps to determine what users view on the page, where they scroll, and other aspects of their behavior.
When analyzing the performance of product pages, you should also consider internal search. See what phrases people look for and whether they correspond with any of your products.
WEBINAR
Piwik PRO for ecommerce:
Get data-driven insights to boost your online sales
Watch the webinar recording and learn how to use Piwik PRO Analytics Suite to improve user experience, optimize product pages, and drive more sales.
Experts opinion
Jude Onyejekwe
Marketing Analytics Specialist at Heddy and Hopp, co-founder of DumbData
Ecommerce businesses face a number of challenges in analytics:
- The lack of proper planning and documentation concerning data collection and its purpose
This oversight can lead to a disconnect among the implementation team, marketing, stakeholders, and analysts. As a result, data may not be collected or communicated effectively to other collaborators who require this information.
To address it, involve stakeholders who need the data early in the process. Planning and documenting what data is collected (spreadsheets can be good for a start) will help facilitate collaboration and more effective data utilization across different business units.
- Knowledge gaps and CMS limitations
The types of user actions in the purchase journey that can be measured vary significantly across different CMS platforms. Additionally, the website’s data layer structure can differ markedly from one site to another, complicating data collection, which can be challenging without sufficient domain knowledge. Limitations in tracking user actions on checkout pages due to security concerns are also challenges in this category.
To solve this issue, it’s essential to identify these challenges and limitations inherent in the CMS. Engaging the right experts or resources is crucial to ensure proper data collection as users move through the purchase funnel and interact with your business.
- Silos in the user journey
Ecommerce businesses that have the capability for users to make purchases both on and off their websites, such as in physical stores or via social commerce platforms like Meta, end up having silos in the user journey and can pose significant challenges in collecting data on purchases made outside the website.
The key to addressing this challenge is determining what is feasible and utilizing available resources to integrate data on non-website purchases into your analytics tools. This approach helps create a more unified view of customer interactions and purchase behaviors across all platforms.
How to use data activation in ecommerce
Effective data activation for an ecommerce business requires the right tools. Customer data platforms (CDPs) allow you to integrate data from your CRM, email software, marketing automation tools, analytics, etc. For example, you can import offline conversions from your physical store. On the other hand, you can activate the audience segments using different tools in your stack, such as ad networks, marketing automation platforms, and A/B tools.
There is a range of goals you can achieve through data activation, such as:
- You can increase your revenue by:
- Offering free shipping to first-time customers.
- Providing product recommendations based on products or services that users show interest in.
- Crafting unique purchasing journeys for different customer segments based on their shared traits.
- You can personalize the customer experience by:
- Retargeting users with ads they are most likely to respond to.
- Showing personalized content to users based on the content they’ve consumed.
- Sending customized email campaigns based on users’ purchase history.
- You can improve customer retention by:
- Uncovering customers who haven’t purchased in a while.
- Recognizing potential cross-selling and upselling opportunities using data about previous behaviors and purchases.
- Retargeting users who abandoned their carts.
Since a customer data platform utilizes first-party data, you can control where the data comes from and what happens with it. This helps you better align with privacy regulations.
Privacy compliance in ecommerce analytics
Safeguarding customers’ data and respecting their privacy has become a new standard. The emphasis on privacy and security stems from the growing number of data privacy regulations, higher consumer awareness, and increasing enforcement of regulations.
Ecommerce compliance means adhering to the rules governing ecommerce activities in the markets you sell in. These include but are not limited to ecommerce regulations per se, data privacy regulations, online payment standards, accessibility norms, and the avoidance of dark patterns.
Ecommerce privacy regulations
The focal point of data privacy regulations is processing personal data and protecting consumers’ privacy online. Since your ecommerce regularly deals with all kinds of personal data, understanding and complying with applicable laws is a must. Check what regulations apply to your business, whether laws affecting specific countries, like German TTDSG/TDDDG or French CNIL’s guidelines, or laws with a broader application, such as GDPR, the Digital Services Act (DSA) or the ePrivacy directive.
Privacy-oriented technological changes
The ecommerce landscape is also being affected by technological shifts. The most notable event is the end of retargeting ad campaigns as we know them due to the deprecation of third-party cookies.
To adjust to privacy-facing technological changes, take the following steps:
- Choose privacy-conscious tech providers that build their tools according to privacy by design and privacy by default principles.
- Ensure the tools you use offer features that allow you to respect visitors’ choices or to anonymize data.
- If you run a business in the EU, consider choosing EU-owned and -based tech platforms.
- Prioritize first-party data sources, which means collecting data using your own sources.
Check out our blog post on privacy compliance in ecommerce for an overview of the most important upcoming laws and technological changes.
Experts opinion
Tim Ceuppens
Freelance Digital Marketer
You collect an abundance of data but how should you use it? For example, do you need to see the details of products that are being added to the cart, or is it enough to learn that a specific channel brings more add-to-carts than others? Most companies lack the scale to get accuracy on highly precise data. If I had to choose between these two, I’d always go for accuracy over precision. Think if you’re able to act on this information. If you can’t, or if it takes too long to get a meaningful sample, choose lower granularity.
With GDPR and cookie banners comes a different challenge: Is the data you’re seeing representative of what is happening? Here are two scenarios: One user clicks on a Meta ad, and another one clicks on a Google Search ad. You’ll find that people who are higher in the funnel tend to default more towards clicking the “don’t allow any cookies” option of the banner. People who are lower in the funnel or previous customers tend to select the “allow all cookies” option. In this case, you will be underreporting Meta visitors and overreporting Google visitors. You won’t be able to stitch all of these sessions together to see what contributed to a purchase in a multi-touch funnel.
A major issue with Google’s Consent Mode is that you can’t extrapolate based on what you didn’t measure. Marketers risk turning down channels that are seeding purchases later in the cycle. Back in the day, we solved it by measuring various channels differently. So, we evaluated a higher funnel channel based on how many add-to-carts we saw, and a lower funnel channel based on revenue and purchases. We did this session by session, instead of user by user, to learn whether each session led to a desired outcome. If it didn’t, we analyzed where it went wrong.
Another challenge is making all of this data understandable and relatable to non-data-minded colleagues. I try to make my dashboards and visualizations simple enough for a five-year-old to understand what’s going right and wrong. Complexity only adds more breaking points to advice that usually already needs buy-in from more than one department. You should show the highlights and have the numbers as a backup when asked for. A correct answer, badly given, pushes you off track and forces you to expend energy you could have used for other things.
Best practices for ecommerce analytics
Below we’ve prepared some tips for getting your ecommerce analytics right.
Take a holistic approach to the customer journey
The concept of a holistic customer journey highlights the complex and diverse ways customers engage with brands. You should view different metrics as components of a bigger picture.
Your goals in ecommerce analytics should be to:
- Reduce friction points along the customer journey.
- Increase the customer’s motivation to buy.
You can achieve these by offering a straightforward user experience and helping people complete their selected tasks.
Respond to the expectations of online shoppers
Understanding why people shop online instead of going to a physical store can help you dedicate resources to the most critical areas of your business.
For example, users appreciate online shopping for:
- Being able to shop anytime – Make sure your website and app work seamlessly on different devices.
- Being able to find their product quickly – Ensure the journey to purchasing a product is smooth and quick. Adjust your purchase process to remove any unnecessary or complicated steps.
- Being able to choose from a wide range of products – Find out what products are the most popular with your visitors and which ones they are looking for. See how to adjust your offer to let them buy more of what they need.
Define your KPIs
Defining and tracking the right KPIs is crucial to your ecommerce analytics strategy. Marketers should establish performance indicators specific to every step of the customer journey and evaluate the success of their activities based on these metrics.
For example:
- In the consideration stage, you want to learn more about user behavior and observe patterns to plan improvements and get more sales. Consequently, your KPIs here could include engagement rate, bounce rate, returning visitors, and cart abandonment rate.
- In the purchase stage, you want to convert more users into buyers. Hence you may track metrics such as orders by new vs. returning customers, average order value by channel, revenue by product, and customer lifetime value (CLV).
To learn more about tracking the right KPIs, check out our blog post: KPIs for ecommerce: Maximizing funnel performance.
Integrate the components of your analytics stack
Integrating your data lets you work on accurate, in-depth data sets and apply the insights you’ve gained to benefit your business. You’ll gain a comprehensive understanding of your customers and take action to drive more sales, improve customer retention, and optimize your store to provide a better user experience.
With an integrated analytics platform, you can connect ecommerce data from all your sources with analytics data and make it available to different teams. When choosing the right platform, ensure it meets your teams’ needs, doesn’t strain your resources, and offers a scalable solution that can grow with your business.
Join the dots between your customers and the data
Marketing tools often provide excessive amounts of data – don’t fall into the trap of gathering as much data as possible. You need to have a purpose for every piece of data you collect. Data becomes valuable when you correlate the numbers with your customers. Looking at data in isolation can lead to errors by obscuring the bigger picture.
Adjust data for seasonality and other trends
Analytics lets you uncover trends, identify patterns and discover seasonality. It allows you to better understand your business’s current performance and how it can potentially look in the future. This, in turn, lets you make more accurate business forecasts that can inform your future actions.
Monitor your product performance over time
Tracking product category and individual product performance over time will enable you to discover your biggest revenue drivers and what you should invest in. It’s a great place to begin if you want to find out what products are performing well and which aren’t doing as well as anticipated.
Ecommerce marketing: How to get enhanced online store analytics
Check out our masterclass and learn how to go beyond ecommerce analytics with Piwik PRO to act on customer insights and drive more sales.
Conclusion
Ecommerce businesses deal with uniquely large volumes of data. However, many truths are the same for organizations in all industries that rely on analytics. Specifically, the road to success is paved with understanding which data points are essential and using that knowledge to continuously improve customer experience.
Interested in learning how Piwik PRO Analytics Suite can help your ecommerce business surface valuable insights?