Regularly assessing your key performance indicators (KPI) is essential for meeting profit targets, remaining competitive, and growing your business. But which KPIs should be prioritized when measuring your ecommerce success? It all depends on your marketing funnel. The more customized your KPIs are to your marketing funnel, the more measurable and impactful they will be.
This article explores the idea of an ecommerce funnel and provides insights on tracking the performance of an ecommerce online store through key performance metrics.
What is an ecommerce funnel?
Marketing funnels represent the various stages of customer journeys. They visually illustrate the steps your customers go through before making a purchase. Often, they also include post-purchase stages such as customer loyalty and advocacy.
Stage by stage, consumers move through the sales funnel until they become repeat customers. Setting up an ecommerce funnel allows you to categorize clients and design efficient marketing strategies.
Read more about funnel and funnel reports in:
What are ecommerce key performance indicators?
A Key Performance Indicator (KPI) measures the success or performance of, for example, an advertising campaign. KPIs are set as targets.
The following are some examples of KPIs in online marketing:
- traffic
- impressions
- cost per click
- cost per conversion
- number of leads
Regularly monitoring and optimizing your KPIs helps make your business more successful and highlights areas that require improvement. Without KPIs, it is hard to know which strategies or processes are functioning and which are not. Properly contextualizing data is essential to understanding customer behavior.
Key performance indicators (KPIs) measure the performance associated with key business goals, while metrics measure the progress associated with specific business tasks.
Ecommerce KPIs and the marketing funnel
The abundance of data and analytics tools can quickly become overwhelming if you don’t set core sales funnel KPIs. Online businesses tend to use several tools to track different ecommerce KPIs. But to discover critical indicators and metrics, it’s best to set up analytics tracking for your ecommerce website if you haven’t done so already. Piwik PRO is a platform that lets you analyze the KPIs critical to your success.
There are many customer journeys
There are many customer journeys
A customer’s experience with a brand encompasses multiple touchpoints and channels, such as websites, ads, email, text messages, mobile apps, social media, call centers, and physical stores.
You must analyze how customers find your website and interact with it. It is crucial to know how much time they spend on your website, the first things they see, the top pages they visit, and where the buying journey starts. Depending on the business, there might be many scenarios and customer journeys. It is vital to understand the complexity of customers’ journeys to provide a positive experience and grow your business.
What’s more, the customer journey doesn’t end with the purchase. It includes how customers use your product, how often they return to buy it again, and if they recommend it to others.
Business strategic thinking is crucial. You have to take into consideration different scenarios and funnel models. Segmentation is helpful, as it allows you to group customers, for example, according to their buying cycle.
For more detailed insights into ecommerce analytics in Piwik PRO Analytics Suite, watch the full episode of our masterclass Ecommerce marketing: How to get enhanced online store analytics
KPI-based measurement
The KPI-based measurement model divides customer journeys into four stages:
- Awareness/discovery
- Consideration
- Purchase/conversion
- Post-purchase
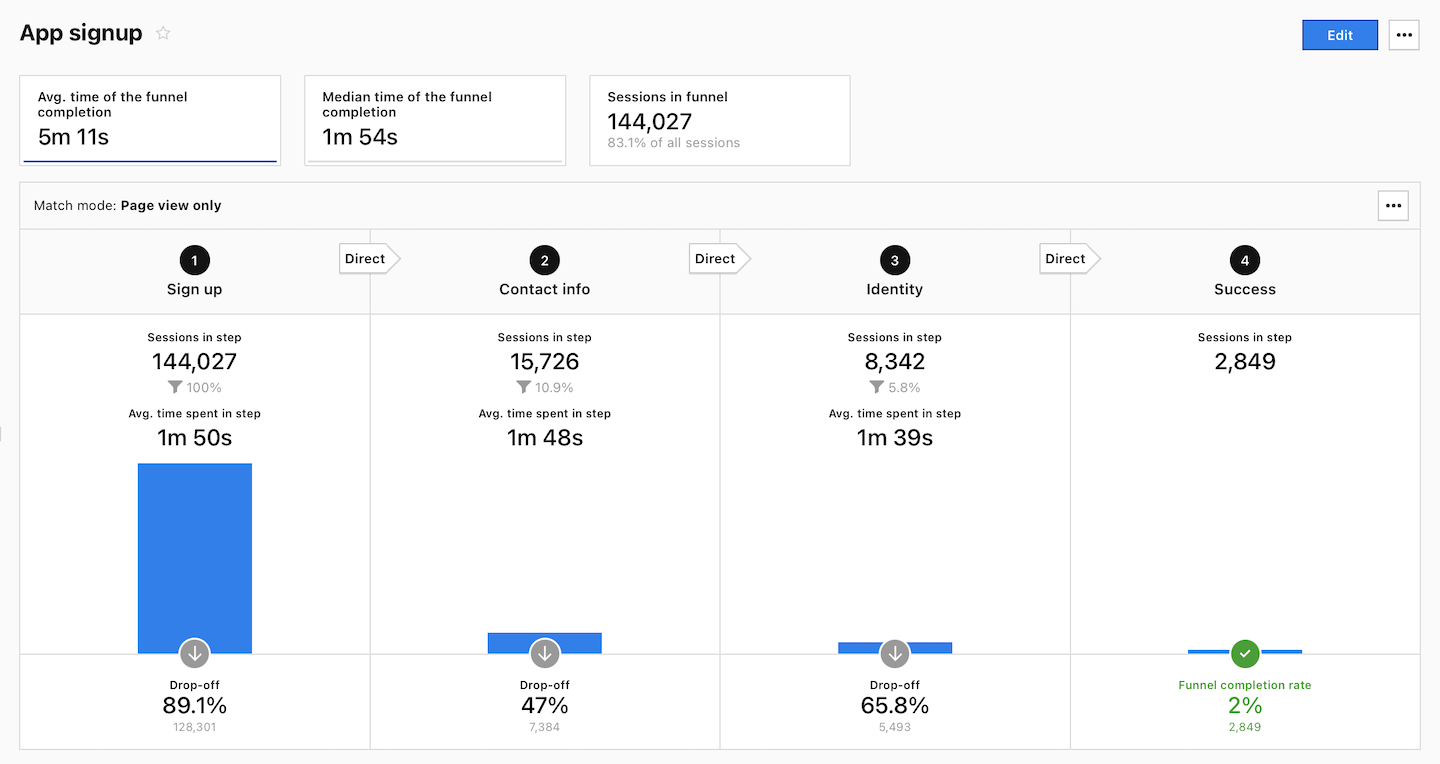
Marketers should establish performance indicators for every step of the funnel and evaluate success of their activities based on these metrics.
Now, let’s talk about how to track the top KPIs for ecommerce at every stage of the marketing funnel.
Unlock the power of your Shopify store with Piwik PRO
Drive smarter decisions with Piwik PRO’s Shopify app. Track customer behavior, product interactions, and sales performance with ease, without the hassle.
The app simplifies setup, ensures GDPR-compliant data collection, and integrates seamlessly with your Shopify store. Gain valuable insights that help you optimize your ecommerce business and stay ahead of the competition.
Ecommerce KPIs for the awareness/discovery stage
Your marketing efforts should be focused on brand awareness and product demand at this stage.
The awareness/discovery stage is where users are just getting to know the brand and what it offers. Consider KPIs that indicate where your new visitors come from, how many visit your site, and whether they are eager to engage.
Your top KPIs can include the following:
1. Traffic source/medium
The source refers to the starting point of your website’s visitors, such as a search engine (for example, Google) or a specific domain. The medium specifies the source type, like organic search (organic) or cost-per-click paid search (CPC).
This KPI is crucial as it allows for customized customer experiences, such as aligning content and guiding users to the next stage of your funnel based on how they find and interact with your website. The most important indicator is the number of visitors/sessions incoming from a specific source/medium since this gives you insight into, for example, whether visitors are coming from channels you’re investing money into.
2. Organic traffic sessions
By monitoring this metric, you can assess your website’s search engine effectiveness, trustworthiness, and influence. It provides insight into the number of visitors discovering your site through search engines, which is crucial for those relying heavily on inbound traffic from search results (SEO).
This KPI provides valuable insight into user behavior by tracking the number of website visitors who found your link through a search engine result page rather than through paid ads. You can increase the number of visits from search engines by improving your content’s ranking in relevant search results with SEO. The main goal of your content should be to entice visitors with a clear intent and use.
3. SEO keyword positions
Keyword performance or ranking refers to tracking the topics and search terms on your website that attract the most traffic. With this KPI, you get different keyword positions and search volume. It’s important because it helps you understand the most relevant and high-impact keywords. This guides your optimization efforts and helps you determine how well your site is positioned for those crucial keywords.
If you want to maintain a strong presence in search engine results, it’s vital to regularly check and optimize your top keywords and pages using keyword data to improve your content. Ranking higher means more visibility, more qualified buyers, and more revenue.
4. Click-through rate (CTR)
The click-through rate is a metric that measures the number of users who clicked a link, call-to-action button, or ad in comparison to the number of impressions it received. You can determine whether your content and marketing campaigns are reaching your target audience by measuring CTR.
It can also help assess how different marketing channels affect a business’s performance. We can identify areas for improving our customer acquisition strategy by analyzing the click-through rate. To improve CTR, you can use strategies like optimizing your headline (use keywords), using appealing images, and direct and compelling call to actions (CTAs).
Ecommerce KPIs for the consideration stage
In the consideration stage, your brand must actively engage with potential and existing customers. The essential KPIs should include metrics connected to sessions and returning visitors.
At this stage, you may observe patterns to perform tests and experiments to improve the user experience. The data from the consideration phase helps you learn about people’s behavior and the time it takes them to make a purchase. All the data from this stage can assist you in making the user experience smoother, eventually leading to higher sales.
The complete Piwik PRO Shopify app playbook
Tap into advanced analytics and a built-in customer data platform (CDP) to improve your Shopify store’s performance. This playbook offers actionable strategies, real-world examples, and step-by-step instructions to help you grow your business while staying compliant with global privacy laws.
1. Engagement rate
The engagement rate is a KPI that evaluates the level of engagement with a product or content. A high engagement rate can result in more clicks and conversions, showing that users are actively interacting and, thus, more likely to convert.
To boost engagement, it is crucial to provide users with a seamless navigation experience across your website or app during their interactions and simplify your demo or transactional forms.
High engagement but low conversions indicate that the content is engaging but isn’t driving users to purchase or that it’s not reaching the right audience.
2. Bounce rate
The bounce rate is the percentage of people who enter a single page and leave it without taking any further action. It is calculated by dividing single-page sessions by all sessions. You can use the bounce rate to measure the success of a single landing page. A high bounce rate indicates that the landing page needs to be improved. Using this metric, you can determine whether the visitor’s search intent was met. Also, it can indicate whether landing pages match the expectations created by ad campaigns.
To reduce your website’s bounce rate, you can improve your site speed, optimize it for mobile users, and make your content more engaging.
3. Returning visitors
With the returning visitors metric, you can determine how many people have visited and returned to a website. You calculate it by dividing the number of repeat visitors by the total number of unique visitors to your site in a given time period. This valuable information can help assess if your website keeps an audience engaged and interested.
For example, you can learn if visitors revisit the same product pages and then proceed directly to the shipping information. This knowledge allows you to improve the content of your product page by providing a link to the shipping information on the product page, reducing the time from consideration to purchase.
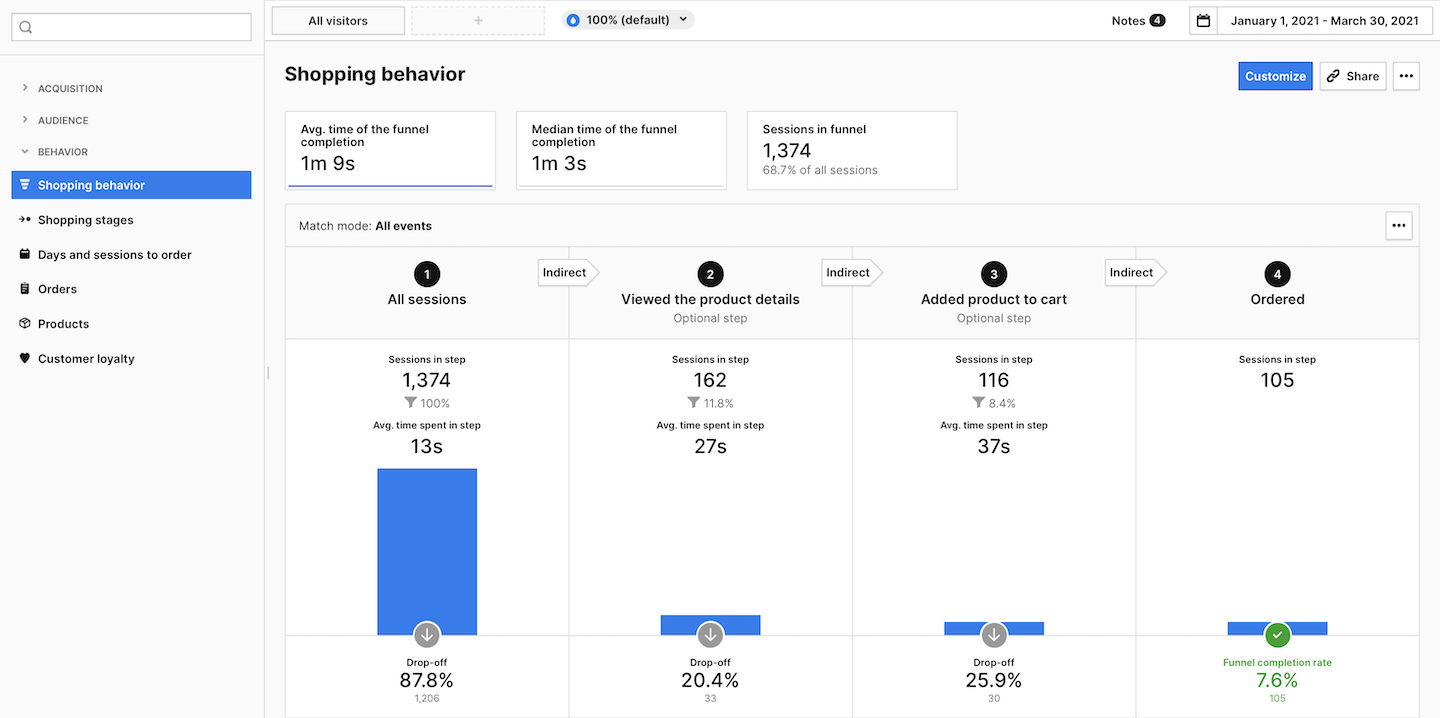
4. Cart-to-detail rate
This metric shows the ratio of cart additions to views of the product page. It is calculated by dividing the number of unique products added to a cart by the number of times they have been visited. This plays a crucial role in showcasing the success of your store’s products. It demonstrates how attractive your offer is to users, how you can provide a positive user experience, and how simple it is to add a product to the cart. And could indicate that a user wants to make a purchase.
A high rate of cart-to-detail means that your store provides a pleasant and user-friendly experience for customers (on the level of product details). A low cart-to-detail rate suggests possible problems with content or pricing, which must be addressed. Monitoring the cart-to-detail ratio can assist in pinpointing potential areas for growth within your store and implementing necessary adjustments. To do it even more effectively, you can combine the cart-to-detail rate with the order-to-detail rate. In the case of a high cart-to-detail rate and a low order-to-detail rate for a given product, there may be an underlying issue in the sales funnel, potentially at the checkout stage.
Providing customers with detailed product information, accurate descriptions, high-quality visuals, transparent return and shipping policies, and clear calls to action can lead to a high cart-to-detail rate.
5. Cart abandonment rate
This KPI is also known as the abandoned cart percentage KPI or the abandonment rate.
It measures the percentage of sessions that had an interaction with a cart but no order.
Frequently, customers add items to their shopping cart but fail to complete the purchase.
The average online shopping cart abandonment rate is 70.19%. A high abandonment rate can be caused by many factors, such as the unavailability of certain payment methods, high shipping charges, or simply the customer changing their mind about the purchase.
With the help of analytics, you can use your top “Exit pages” to pinpoint areas for improvement and identify drop-off points.
6. Site search usage
Visitors can use site searches to find content on websites, such as product pages, product catalogs, articles, videos, and more. By analyzing site search usage, you can gain a better understanding of how visitors use your site’s search function, including the search terms they enter and the impact of the search results on engagement with your site.
By focusing on this metric, you can significantly enhance your website’s traffic conversion and decrease the bounce rate. With the data, you can adjust your site search and provide a better user experience from the first few seconds of interaction.
Neglecting your internal site search could lead to a poor user experience (UX) and ultimately depress your profits.
Intent plays an important role in the consideration stage.
Intent plays an important role in the consideration stage.
To discover your customer’s intent, you might use interviews run, for example, via customer support chat to gain a powerful source of insights. You may ask your customers where their journey has started, how they arrived at the website, or about factors they have in mind before purchasing – for example, what other products they consider.
Ecommerce KPIs for the purchase/conversion stage
Accurate revenue tracking is crucial in this stage.
Piwik PRO’s Currency Conversions feature allows you to consolidate revenue from various currencies into a single standard currency, providing a clearer view of your financial performance. Learn more in our article: Currency conversion.
To convert more visitors into buyers, consider keeping track of the following metrics:
1. Orders new vs. returning
When analyzing orders by new vs. returning customers, we look at the number of orders from new customers compared to returning customers over a given period.
When you analyze and compare data on orders by new vs returning customers, you can identify trends, patterns, and areas for improvement. For example, many repeat customers suggest that the company maintains a loyal clientele, a vital factor in sustained growth and financial success. Keeping customers is often more cost-effective than attracting new ones, as repeat customers are more inclined to make future purchases and recommend the brand to others.
Tracking the ratio of orders from new and returning customers is essential to gauge the success of marketing efforts and loyalty programs. Returning customers often show their satisfaction and loyalty to the brand, while a large number of new customers can indicate effective acquisition strategies.
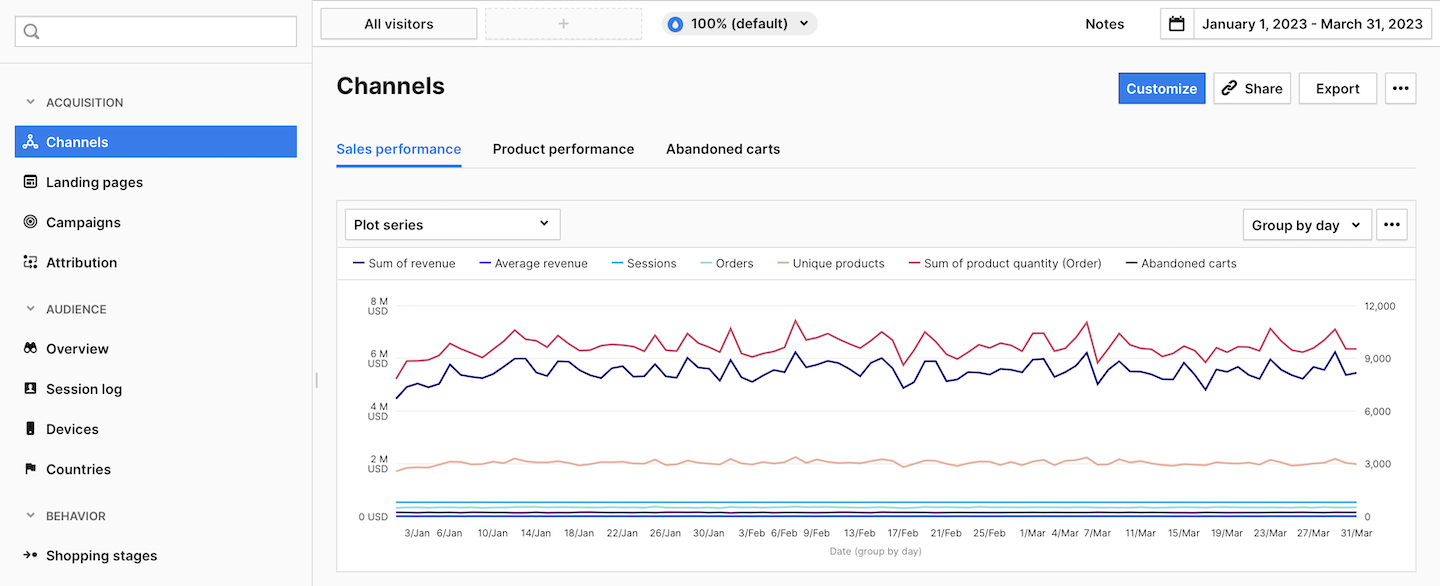
2. Average order value by channel
The average order value (AOV) is the average value of each order placed through a specific channel over a set period. This metric is calculated by dividing the revenue by the number of orders. It allows you to see which traffic channels generate the most revenue and consequently justify allocating a larger budget. You can analyze the revenue generated through different sales channels, such as marketplaces like Amazon, social media, email marketing, and your online ecommerce store.
Tracking also helps you analyze customer buying patterns and return on investment (ROI) from advertising spend, thus improving your profitability. For instance, if people spend significantly less than the product’s price, it could indicate heavy use of discounts, so you may need to reduce them.
Each channel offers various combinations of audience reach, content, or performance. It’s important to carefully consider which channels or combination of channels will provide the best returns.
3. Revenue by product
Revenue by product is the percentage of total revenue generated by a particular product. It helps you identify the products with the highest sales, demonstrating their value and importance to the company. It will also help you identify which products are not generating enough revenue.
Based on this information, you can determine whether any of your products should be discontinued, promoted, or marketed more effectively.
Top-bought products
This is another KPI for effective product performance evaluation. It allows you to see your most popular products in terms of volume and revenue in a given period.
4. Revenue per visitor (RPV)
By using this KPI, you can monitor the revenue generated by your business from each customer visit. To calculate this metric, the total revenue is divided by the number of website visitors during a given timeframe.
If you understand how much revenue you generate per visitor, you can identify areas where you need to improve your marketing efforts and optimize your campaigns. This insight allows you to enhance your website. For example, a low RPV could indicate the need to enhance your website’s user experience, which can help drive more sales. Thanks to this KPI, you can also adjust your product pricing or marketing messages to appeal better to your target audience.
5. Customer lifetime value (CLV)
The customer lifetime value reflects the total profits customers generate throughout their interactions with the company. To calculate customer lifetime value, you must multiply the average purchase value, purchase frequency, and customer lifespan of your clients.
This KPI is important as it helps you better understand your current customer base and who you should target to maximize profits. Instead of solely focusing on acquiring new customers and investing heavily in gaining them, you can identify what keeps your existing customer base loyal and replicate those strategies to increase the value of your current customers.
Ecommerce KPIs for the post-purchase stage
You should not focus solely on one transaction. In the long run, retaining existing customers and building their loyalty is cheaper than acquiring new ones. You can increase profits and brand loyalty by incorporating these metrics into your strategy.
Here are the last phase KPIs:
1. Average days between transactions
This metric measures the time gap between a customer’s initial and subsequent purchases. This provides valuable information about your customers’ behavior, which you can use to intervene in the customer journey and encourage another purchase. Your business can benefit from it by sending appropriate messages strategically to increase purchase frequency. You will know when it’s the perfect time to send a new personalized sales-focused email to your customers just before they are expected to place another order.
2. Repeat purchase rate (RPR)
In this KPI, we measure how many customers make multiple purchases with a company. To determine your RPR, analyze the number of repeat customers on your online store and divide it by the total number of customers.
RPR shows how effective you are in keeping customers and encouraging their loyalty. In ecommerce, this is crucial because repeat customers generate higher revenue and can attract new customers through word-of-mouth. This KPI is important as it measures your customer loyalty and customer retention and helps identify potential issues.
A high RPR indicates that your customers are happy with your products, services, and overall experience. They are loyal to your brand and willing to return for future purchases. A low RPR could suggest potential product, service, or customer satisfaction problems. You can identify and address these issues early by monitoring repeat purchases.
3. Return on investment (ROI)
ROI is a crucial metric for your business, indicating the amount gained (positive ROI) or lost (negative ROI) in comparison to the initial investment. Return on investment is typically shown as a percentage or ratio, calculated by dividing the gain or net benefits earned by the cost you paid.
ROI provides marketers with a way to measure the effectiveness of their advertising efforts and aids in making strategic decisions regarding budget allocation, campaign optimization, and strategy adjustments. By monitoring ROI, you can make informed decisions to improve advertising performance and ensure significant results from campaigns.
Choose the right analytics platform for your business
Effective evaluation of a marketing ecommerce funnel relies heavily on key performance indicators. By measuring these metrics, marketers can gain insight into different phases of the customer journey, allowing them to make informed decisions.
But there is more to it: organizations utilize KPI analysis to enhance their products, mitigate risk, and drive revenue growth. Expand your ecommerce analytics capabilities by moving away from generic tools to platforms like Piwik PRO that prioritize critical thinking, simplicity, and adaptability. You can gain valuable insights and a deeper understanding of your KPIs and customer behavior with reliable data, custom metrics, and various integrations.
If you want to learn more about ecommerce analytics, read:
Are you looking to leverage ecommerce KPIs analytics to perfect your marketing strategy and boost customer conversions?