
SUMMARY
- Raw data is the unprocessed, complete set of information collected directly from various sources. In contrast, aggregated data is processed and summarized, making it more accessible. Organizations often prefer aggregated data for quick insights, but raw data offers greater flexibility for advanced analytics and custom reporting.
- Accessing raw data enables organizations to perform sophisticated analyses that lead to a better understanding of customer behavior and marketing effectiveness. It allows for the blending of data from multiple sources and supports advanced statistical analyses.
- Organizations can use raw data in many ways, including tracking complete customer journeys, personalizing user experiences, conducting advanced A/B testing, predicting churn, fulfilling regulatory requirements, anomaly detection, and more.
- While raw data offers significant advantages, it also presents challenges, such as requiring substantial technical resources and expertise to manage effectively. Organizations must invest in the right tools and personnel to leverage raw data effectively.
Raw data offers infinite potential as a resource, as it comes in diverse forms from a wide range of sources. While it is highly valuable, raw data can also be challenging to organize and understand. It takes time, resources, and technical expertise to draw actionable insights from it.
Many companies settle for aggregated data in the form of reports and calculations that they can access in the UI of analytics tools. As a result, these organizations fail to utilize the tremendous potential of raw data.
Before organizations can harness the power of raw data to learn more about their customers and their sales and marketing campaigns, they must first collect the right data, organize it, and transform it into a more appropriate format. These preparatory steps are crucial for effective data analysis and visualization.
In this article, we will explore the benefits and challenges of using raw data in analytics and discuss its potential use cases for gaining valuable insights.
What is raw data?
In the context of web analytics, raw data is a set of events and sessions collected from visitors’ activity on a website or app, then processed to prepare reports. An organization can gather raw data from multiple sources, such as web analytics, mobile app usage, advertising platforms, search engines, social media, CRM, CMS, email marketing platforms and others. Raw data is the initial data collected directly from sources without manipulation or analysis.
Each source can provide data in different formats. Depending on what is supposed to be done with the data – for example, it may need to feed a data warehouse – it might require additional transformations, such as cleanup or reformatting.
Because raw data is not filtered or processed, it provides a complete view of information. It allows for in-depth analysis and accurate insights, but also may be voluminous and difficult to handle.
With proper tools, raw data provides more possibilities for exploring data insights and making them useful. Analyzing raw data like this can help marketing analysts uncover trends, identify customer preferences, and develop targeted marketing strategies to enhance customer engagement and boost sales.
Raw data vs. aggregated data
Raw data typically comes in its most basic form, representing visitors’ behavioral data (such as page views, clicks, impressions, scrolls, and more) along with contextual data (such as which ad was viewed or clicked, from what device, country, and others).
On the other hand, aggregated data refers to data extrapolated through aggregation performed on raw data. Such aggregations can be done by web analytics tools or, in more complex approaches, with the use of business intelligence (BI) tools that can pull data from a data warehouse or other sources. Aggregated data is most commonly available in the UI of analytics platforms in the form of reports, making it more accessible.
These differences between the two data types determine the needs they are able to satisfy and the depth of the possible analysis.
For example, building attribution models on your own can be very challenging and time-consuming, while web analytics tools can have them built in. In this case, you can access some insights much faster. On the other hand, if more advanced statistical analysis is needed to find trends and relationships or perform tests and experiments, working with raw data offers more control over that process.
Raw data
Advantages
- Opens the door to more advanced analysis like statistical analysis, custom attribution models, building customer journeys, and exploratory data analysis.
- Provides the ability to blend data from multiple data sources and create a more comprehensive picture for making data-driven decisions.
- Offers flexibility to revisit and reanalyze the data for a range of reporting needs.
Disadvantages
- Requires extensive resources in terms of technology and people who can build and maintain the data stack.
- Less accessible for inexperienced analysts who are not proficient in BI tools or SQL.
- Handling large datasets or using APIs for raw data extraction is more resource-intensive, particularly in advanced analytics.
- As a less technical specialist, you may experience delays between a request to the more skilled analyst or engineer and getting an update on data in the report or dashboard.
Aggregated data
Advantages
- Accessible to everyone regardless of experience level.
- Doesn’t require extensive technical resources and skills to visualize the data.
Disadvantages
- Limited to the capabilities of the aggregation engine in use in terms of filtering, grouping and aggregate functions.
- Less flexibility in case more advanced statistical analysis is needed.
Learn more about the differences between data types used in analytics: Raw data and sampled data: How to ensure your data is accurate.
What are the benefits of raw data in analytics
Raw data unlocks the door to more sophisticated and precise analytics, enabling a better understanding of information that often remains untapped in summarized data formats.
With appropriate expertise and technical skills on the team, businesses can dive deep into advanced analytics. Access to raw data allows analysts to work with complete datasets that they can review and modify at any time. They can apply new filters and visualizations and generate new insights or points of view.
Raw data analysis is highly relevant, specific to the research being done, and provides fresh information, making it suitable for supporting data-driven decisions. As it gives preliminary visibility to the dataset, it offers more freedom in data transformation. On top of that, raw data gives you a backup to refer to in case of problems after processing and analyzing your data.
Businesses can combine raw data from various sources, such as CRMs, transaction platforms, offline databases, and more. This allows them to connect the dots and make more data-driven decisions. Thus, companies can easily integrate analytics software with their existing marketing stack to maximize the benefits of their entire toolset.
Raw data can be exported from analytics platforms using other tools, enabling more extensive and insightful analyses. For example, you can export raw data to business intelligence (BI) and data visualization tools to gain more options beyond simple analytics reports. You get to connect multiple data sources and clean up, shape, and model your data set into the required use case. Such visualizations may show patterns that would otherwise remain invisible.
Exporting raw data from several different reports and combining it with other external data can give you a global view of your marketing performance across channels. For example, you can effectively use raw data to analyze multi-channel attribution.
What are the use cases of raw data
There is little value in holding onto raw data without the means to use it. This type of data offers many options beyond standard processed or sampled data approaches.
You can leverage the power of raw data to provide more detailed, accurate, and actionable insights for web and app analytics.
Let’s now discuss typical use cases of raw data.
Tracking complete customer journeys
Raw data from multiple sources can be used to track the complete customer journey and create a holistic view of user behavior across different platforms. This type of data represents consumers’ unaltered voices and behaviors.
Whether it’s the transcript of a focus group discussion or the record of online purchases during a holiday sale, raw data captures the market in its most natural state. By connecting these data points, organizations can understand how users move between different platforms and how their campaigns lead to conversions.
Personalizing the user experience
Leverage raw data to identify specific user groups with unique behaviors or needs. This enables in-depth user segmentation and cohort analysis, allowing for more targeted marketing strategies. Apply this information to dynamically adjust website layouts and provide real-time content recommendations and product suggestions, creating highly personalized user experiences.
For example, if you run an ecommerce business, you can perform a Recency, Frequency and Monetary (RFM) segmentation to identify your most valuable customers. Piwik PRO Customer Data Platform allows you to create audiences in the RFM model and enable marketing automations with personalized communications for specific audiences.
Advanced A/B testing
Use raw data to conduct complex A/B testing and multivariate analyses beyond simple conversion rates. Analyze user paths, interaction times, and behavioral patterns to understand why certain variations perform better and which copy, page design, or content format you should choose.
Predicting and preventing churn
Utilize raw data on user engagement, feature usage, and historical patterns to build predictive models identifying users at risk of churning. This allows for targeted retention strategies and personalized interventions to keep users engaged with your product or service.
Attribution modeling
Organizations can use raw data for attribution modeling, either by doing it themselves or using external partners that have the know-how and built in-house attribution modeling algorithms. They can then create advanced, custom attribution models that go beyond standard last-click or first-click models.
Attribution modeling involves using data analysis and statistical modeling techniques to determine the contribution of each marketing touchpoint in driving conversions or sales. Companies can understand how to allocate marketing resources to better convert their target audiences.
Custom dashboards
Businesses can approach raw data with different analytical tools and derive insights based on changing needs.
For example, raw data can be used to create insights dashboards in BI tools or companies’ apps for internal or external needs. Agencies might also compile reports for their clients using raw data. These dashboards can help organizations visualize their data and extract meaningful insights.
Fulfilling regulatory requirements
Certain client segments, such as government entities or media, may have to adhere to regulations that require them to send data to regulatory and controlling entities. Raw data can help organizations operating in various sectors adhere to regulations, for example:
- Healthcare providers often must send raw data to government entities for public health monitoring, research, and regulatory compliance. This includes data related to patient demographics, diagnoses, treatments, and outcomes.
- Banks, insurance companies, and other financial institutions often need to send raw data to regulatory bodies for compliance with financial regulations. This can include data on transactions, customer behavior, risk assessments, and more.
- Telecommunications companies may need to send raw data to regulatory entities to comply with regulations related to network performance, customer service, pricing, and more.
- Retailers may need to send raw data to supply chain partners or regulatory bodies. This can include data on sales, inventory, customer behavior, and more.
- Government entities often need to send raw data to other government bodies for oversight, coordination, and compliance with laws and regulations.
Public service organizations in the EU need to share information about the people who visit their websites with the Single Digital Gateway (SDG). To fulfill this requirement, use Piwik PRO’s integration with SDG.
- Media companies may need to send raw data to regulatory entities, primarily if they are based in countries with strict media regulations. This can include data on viewership, content, advertising, and more.
Accessing reports outside analytics platforms
Companies can explore methods for integrating raw web analytics data with other business intelligence (BI) tools and data sources. This can provide a more comprehensive view of business performance and enable more sophisticated data-driven decision-making across the organization.
Additionally, organizations might want to access raw data without creating accounts in their analytics platform. In such cases, downloaded raw data can be made available as reports in tools like Power BI, and anyone within the organization can access it.
Anomaly detection and alerting
Analysis of raw web analytics data streams allows you to identify unusual patterns or anomalies in raw server logs, user behavior, performance metrics, traffic sources, or conversion rates. With this information, you can detect system failures or performance issues as they arise.
For example, you could develop an automated system that alerts stakeholders about potential issues or opportunities, allowing you to take immediate action and minimize downtime.
How different analytics vendors handle raw data
The capabilities of accessing, exporting and using raw data vary across different analytics platforms. Here’s a quick overview:
| Access to raw data | Data export limits | Data access and tools | |
|---|---|---|---|
| Piwik PRO | Yes | Piwik PRO Business – data exports available through API. Piwik PRO Enterprise – data exports available through daily exports and API. – API is recommended for data sets of up to a few million events. – Daily exports are suitable for exporting up to 100 million events per day. | Full access to raw data through API, BigQuery and CSV. |
| Adobe Analytics | Access to raw data through its predefined tools. | No explicitly stated data export limits. | Several ways to access and use raw data, including Analysis Workspace, Analytics dashboards, Activity Map, Report Builder, Analytics APIs, and Reports & Analytics. |
| Google Analytics 4 (GA4) | Access to raw event and user-level data through BigQuery. | Export limit of 5,000 rows when you download a report as a CSV. | Raw data can be accessed and exported through Reports or Explorations in the GA4 web interface, Analytics Data API, and BigQuery. |
| Countly | Yes | No explicitly stated data export limits. | Several ways to access and use data, including through its server, a mobile SDK for mobile analytics, or a web SDK for web analytics. |
| Mixpanel | Yes | At most two recurring pipelines and one non-recurring pipeline for event export pipelines per project. The raw export API has a rate limit of 60 queries per hour, 3 queries per second, and a maximum of 100 concurrent queries. | Data can be accessed via HTTP API or direct database export. Raw data can be viewed in Mixpanel. |
| Matomo | Yes | No specified data export limit. The data can be exported in full. | Data can be accessed via HTTP API or direct database export. Raw data can be viewed in Matomo. |
| Amplitude | Yes | CSV report: 5,000 users from Users page, 100,000 rows of data per metric from Charts view. | Over 20 SDKs, HTTP API v2, Batch API, and SQL access. |
| Snowplow | Yes | No specified data export limit. | Storage options for data warehouses and lakes, loading data into Redshift, BigQuery, Snowflake, and Databricks, and querying data. |
| Heap | Yes | CSV report: 5,000 users from Users page, 100,000 rows of data per metric from graphs and funnels. | Tracking events, querying data, and using a data model to aggregate data. |
How can you benefit from raw data access in Piwik PRO
Piwik PRO gives you easy access to session- and event-level raw data to perform extensive data analyses.
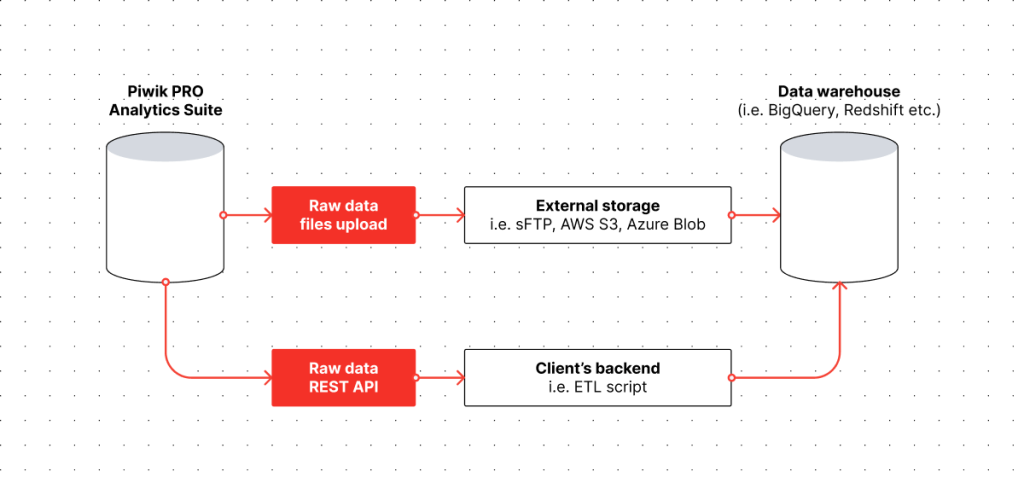
You can access raw data in Piwik PRO by:
- Uploading raw data files to your sFTP, AWS S3, Azure Blob, or BigQuery.
- Connecting to Piwik PRO’s REST API and pulling full or filtered raw data sets.
You can also use ready templates and connectors for tools like Power BI, and Looker Studio.
Piwik PRO allows you to use raw data without extra costs using the API. For a fee, you can also access raw data in daily exports. You gain access to historical data from up to 25 months ago. You can export the data from a report directly to a CSV.
You can integrate different types of data to build the necessary reports with ease. Here are a few methods for linking analytics data with another data set:
- Using BI tools like Power BI or Looker Studio by connecting them with Piwik PRO. This solution is fairly easy and accessible for many people. However, there may be issues with data integrity and low performance in the case of big data sets.
- Using data movement (like Fivetran) or data integration and management platforms (like Supermetrics). Both of these tools have native connectors to Piwik PRO. These platforms integrate with many data sources and can push data to many destinations. Additionally, Supermetrics offers the ability to extract data from different sources, blend it and prepare it for reporting – for example, in BI tools.
- API integration and building a custom data pipeline. This option offers more control and flexibility in data wrangling but can be costly as it requires developers to build the data pipeline.
Best practices for working with raw data
To start benefiting from raw data, you must set up an optimal process to cover its collection, export and analysis. By following this process, you can gain deeper insights into user behavior and make data-driven decisions for your business.
Here is a sample step-by-step workflow for effectively applying raw data:
- Identifying raw data sources – Begin by determining which data points you will need, such as events or user properties, and where the data will come from. This includes internal sources (like CRM systems, sales data, etc.) and external sources (market research, social media, etc.).
- Data collection and integration – Gather data from the identified sources. When retrieving the data for your analysis, ensure it’s comprehensive, accurate, and relevant to your research or project. Use an appropriate method, such as the API, to get the raw data from your analytics platform. If applicable, make sure you integrate data from multiple sources.
- Data cleaning and preparation – This step involves cleaning and organizing the raw data to make it suitable for analysis or visualization. Make sure you remove duplicate or irrelevant data points, handle missing or erroneous values, and standardize data formats and structures.
- Data export – Exporting the raw data helps broaden the scope of analysis and provides more detailed insights. Choose a suitable format (such as CSV or JSON) and export method. In the case of large datasets, consider incremental exports or using cloud storage solutions.
- Data analysis – Import the raw data into your preferred analysis tool. Apply various data analysis techniques to uncover patterns, trends, and insights. These include statistical analysis, predictive modeling, data visualization, and more. Create visual representations like charts, graphs, and plots to make complex data more understandable.
- Interpreting the results – Connect the insights from your analysis to business goals and KPIs. Based on your findings, you should be able to develop actionable recommendations. Communicate the results effectively by documenting the methods, findings, and conclusions clearly and concisely.
- Refining the raw data process – Continuously adjust your process to ensure its effectiveness. Update tracking and export procedures as your analytics needs evolve. Regularly validate the accuracy and relevance of your data.
Conclusion
Raw data can provide precision and depth, leading to more accurate and insightful decisions. Both sampled and raw data have their place in data analytics. They can significantly benefit decision-making processes and play a vital role in an organization’s sustainable growth and success. However, in the end, accurate data fuels accurate decisions. Raw data is a way to do more with your data, perform in-depth analysis and use your insights in data-driven marketing.
If you want to learn more about how you can use raw data in Piwik PRO to do more with advanced analytics, reach out to us: